D1-N Series Servo Drive User Manual Tuning
6-12 HIWIN MIKROSYSTEM Corp.
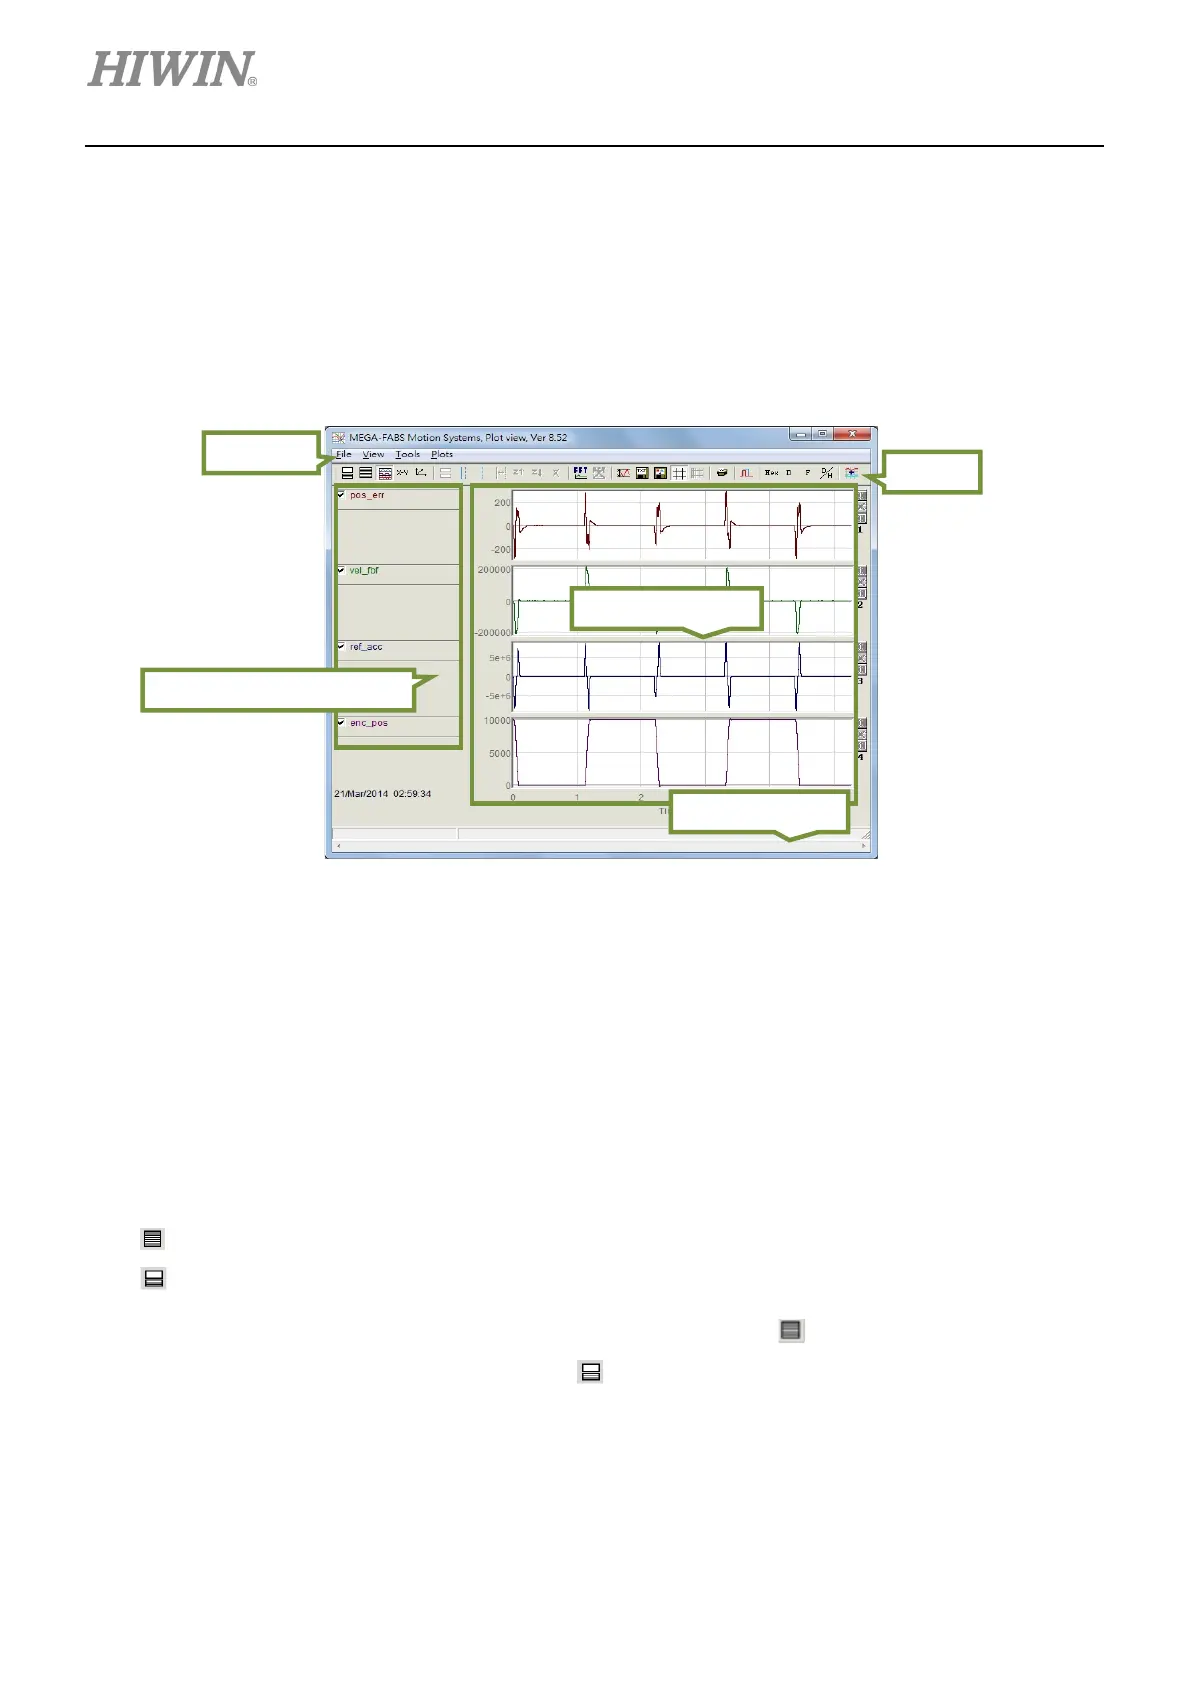
6.5 Plot view
Data collected in Data collection window can be plotted as graph. Plot view window provides
measurement and calculation functions for analysis. There are five areas in Plot view window: menu bar,
toolbar, physical quantity display area, graph display area and timeline scrollbar, please refer to figure
6.5.1.
Figure 6.5.1 Plot view window
6.5.1 Display mode
Number of display channels
The graphs of physical quantities will be displayed in graph display area. Plot view window displays
the graphs of physical quantities captured in Scope or by Data collection. Users can modify the
number of display channels. The maximum number of display channels is eight. Icons in Plot view
window are described as below.
-
: Set the number of display channels.
-
: Display one channel only.
If users would like to view two graphs at the same time, click on and select 2 graphs. If users
would like to view only one graph, click on
and select the desired graph to be displayed, as
figure 6.5.1.1. In figure 6.5.1.1, two physical quantities are captured in Scope or by Data collection.
Physical quantity display area
 Loading...