D1-N Series Servo Drive User Manual Tuning
HIWIN MIKROSYSTEM Corp. 6-37
6.7.2 Tool
The spectrum analysis tools of Loop constructor can simulate and analyze the Nyquist plot, Bode plot and
Nichols plot of control system. The frequency response of control system can be obtained by using
spectrum analysis tools.
6.7.2.1 Frequency response function
Frequency response can be expressed in the transfer functions of dynamic system which show the
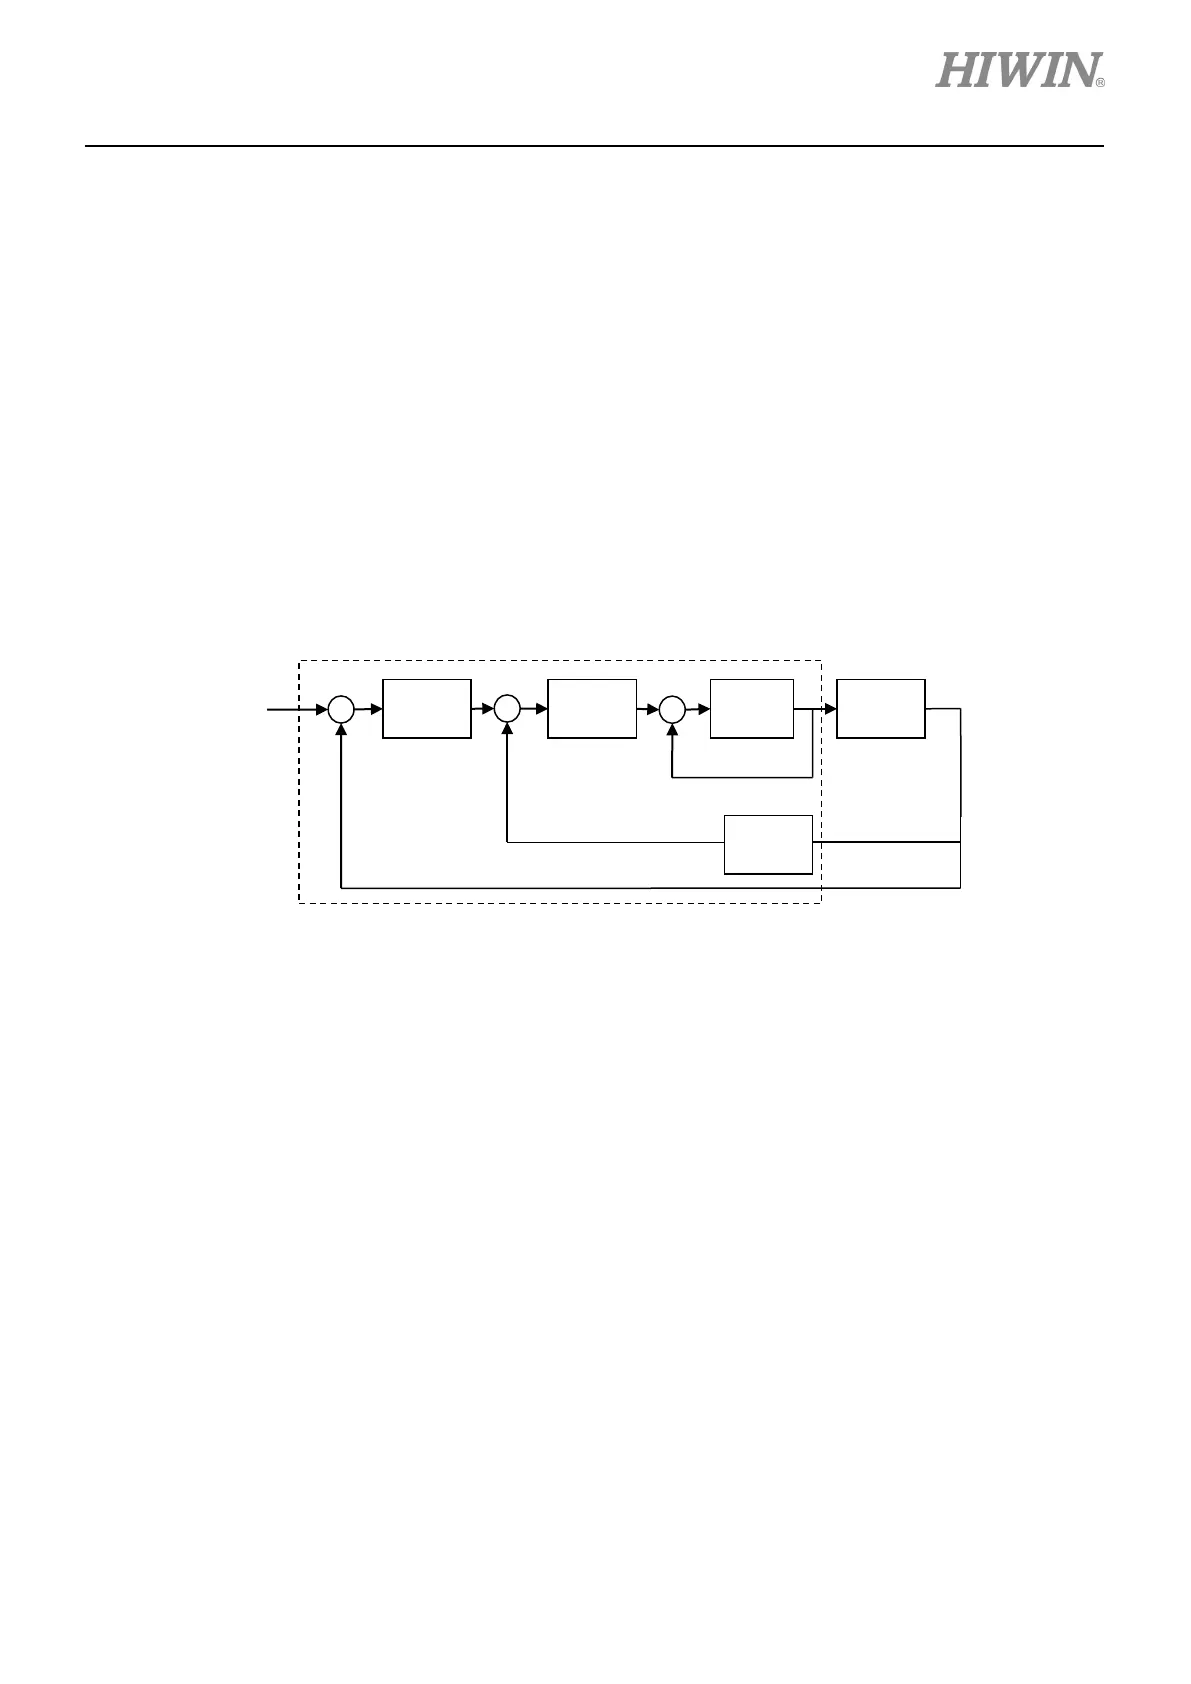
relationship between input signals and output signals. The control architecture of the servo drive is shown
in figure 6.7.2.1.1.
Figure 6.7.2.1.1 The control architecture of servo drive
(1) U(s): System input (Servo drive command)
(2) Y(s): System output (Position feedback of encoder)
(3) Plant: PL(s) is the relationship between servo drive command and feedback position. Plant includes
mechanical platform, motor and feedback system.
(4) Controller: P(s) is the position loop controller. V(s) is the velocity loop controller. C(s) is the current
loop controller.
(5) Open loop: The transfer function of open loop system is G(s) = P(s)*V(s)*C(s)*PL(s). All feedback
signals are ignored.
(6) Closed loop: The transfer function of closed-loop system is T(s)= P(s)*V(s)*C(s)*PL(s)/((d/dt*
P(s)*V(s)*C(s)*PL)+ P(s)*V(s)*C(s)*PL).
 Loading...