Panther System
®
Operator’s Manual
AW-17791-001 Rev. 002 (EN)
152
System Operation
a = The date that the first control/calibrator was pipetted.
b = Sequential run number starting with 01 for the first worklist started on the
date.
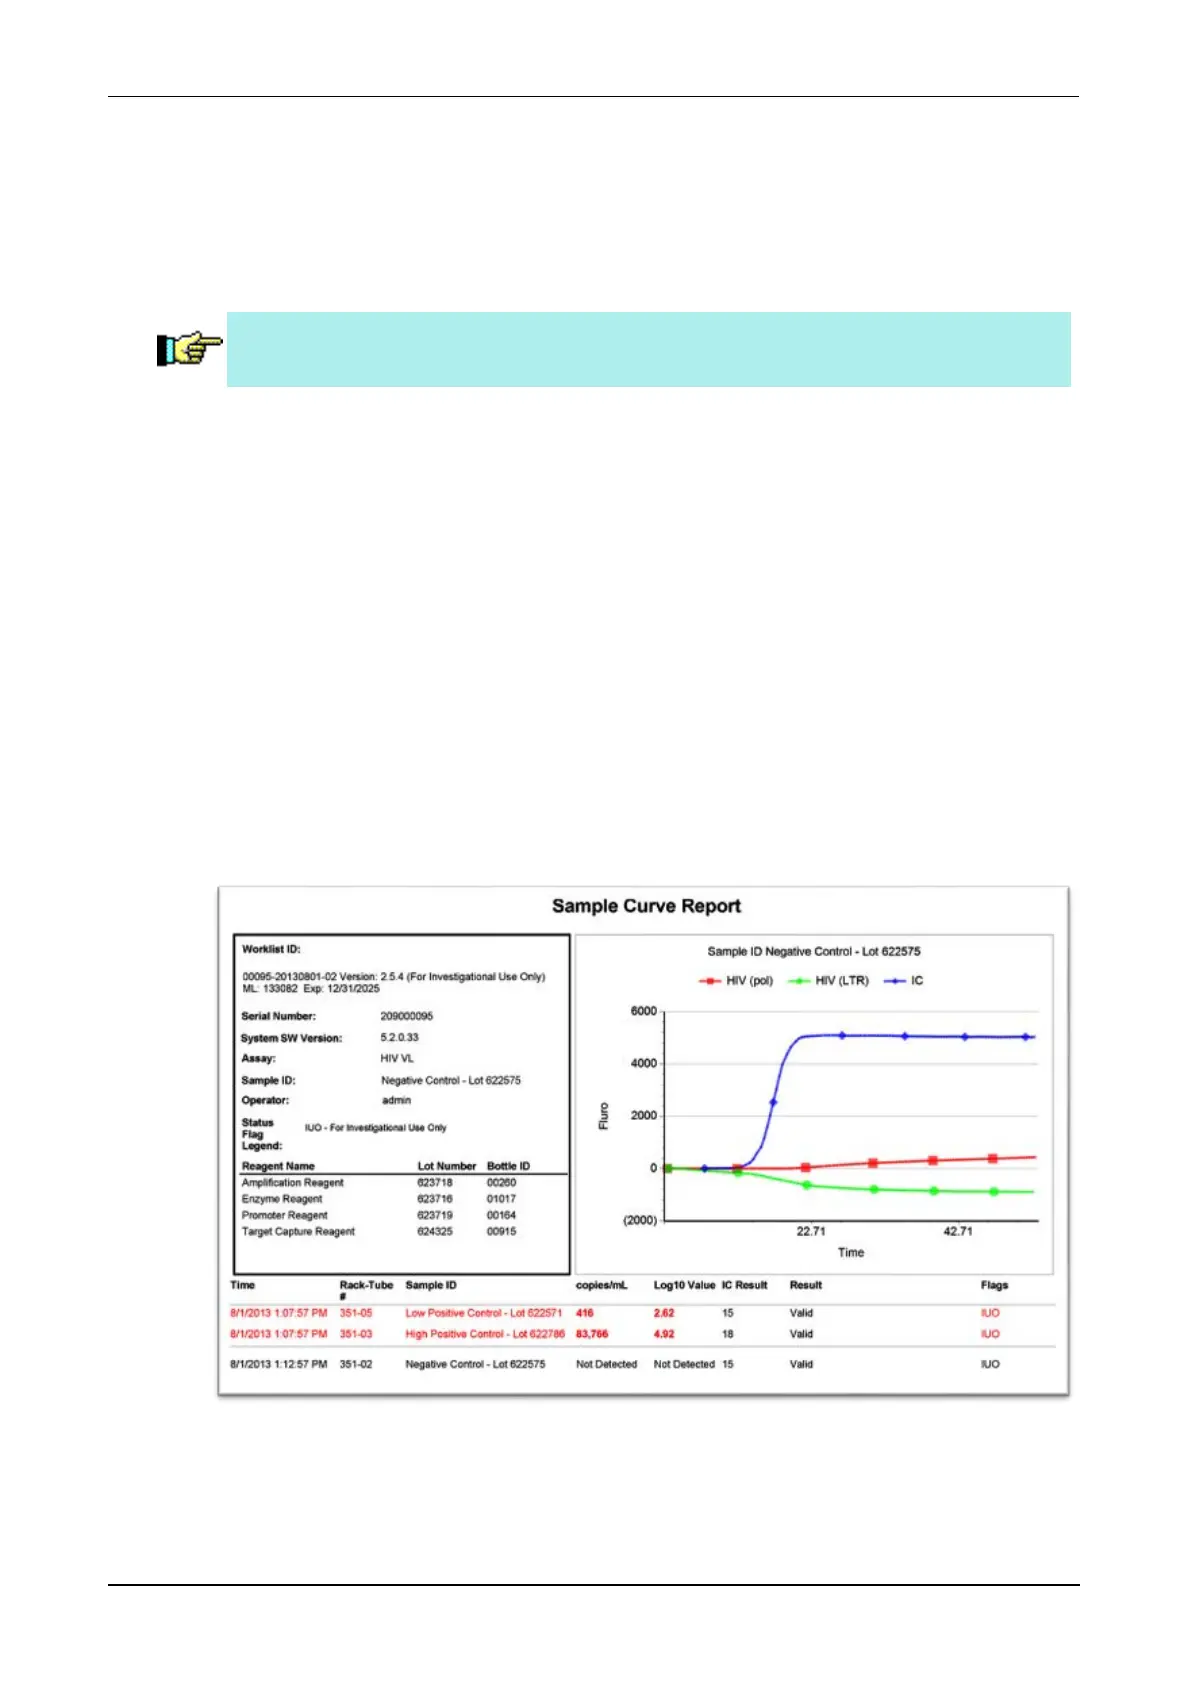
Sample Curve Report
Note—This feature is not available in all system software configurations.
Additional information for specimens tested with real-time assays can be found in the
Sample Curve Report. The report contains a result summary that is specific for the
specimen including reagent information and a chart of the normalized representation
of the specimen's fluorescence profiles over the course of the reading frame. The
curve chart contains Relative Fluorescent Unit (RFU) data on the Y axis as
measured over time on the X axis.
Results data contained in this report can also be found on the Results screen and
through related results reports found on the Report Menu screen (see Results Screen
on page 73 and see Report Menu Screen on page 75).
To access the Sample Curve Report:
1. From the Results screen, select the row of the test order.
2. Select Curve Data.
A window opens that contains the Sample Curve Report.
Figure 78. Sample Curve Report (Example)
 Loading...