51
5 Operation
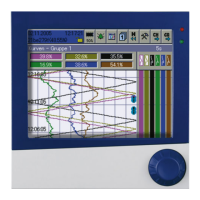
5.4.3 Bar graph
In the bar graph view, the analog signals configured for the relevant group are shown as bar graphs, and
the digital signals – depending on their logical state – as colored areas or frames.
The diagram type selected for the group (horizontal, vertical) is irrelevant for the bar graph view. The
view is always as a column diagram (vertical) and not as a bar diagram (horizontal).
Group view
(1) Signal abbreviation (configurable) of an-
alog signal
Call up individual view of analog signal
(numerical view and bar graph); see text
image - individual view.
(4) Current analog value (color change in
the event of an alarm)
(2) Bar graph of the analog signal (color
change in the event of an alarm)
(5) End value of scaling (display range, con-
figurable)
(3) Digital signal with signal abbreviation
(configurable) and designation (pointer)
(6) Limit value for max. alarm (configurable)
Displays the logical state:
Colored area = HIGH (B1, B3)
Colored frame = LOW (B2)
(7) Limit value for min. alarm (configurable)
(8) Start value of scaling (display range,
configurable)
(9) Go to next active group
(2)
(3)
(1)
(5)
(8)
(4)
(9)
(6)
(7)