R&S
®
ZVA / R&S
®
ZVB / R&S
®
ZVT Measurement Examples
Harmonics Measurements
Operating Manual 1145.1084.12 – 30 94
measurement. You can choose between a one path two port and a full two port calibration for the analyzer
ports 1 and 2. It is recommended to select the AVG detector in the calibration wizard.
Perform a manual or automatic calibration for your test setup as outlined in the Calibration example.
To measure the noise figure...
The default trace shows the forward transmission coefficient S
21
, which is a measure of the gain, if the
measured DUT is an amplifier. For a wide class of test setups the noise figure of the DUT can be
measured and displayed in parallel to the S-parameters.
1. Establish the measurement test setup, connecting the external attenuator and the DUT as shown
above (see Test setup for noise measurement).
2. Select Trace - Trace Select - Add Trace + Diag Area to create a new trace Trc2.
3. Select Trace - Measure - Noise Figure. In the dialog opened, ensure matching port assignments
(Dut Input: Port 1, Dut Output: Port 2) and click OK.
The new trace Trc2 shows the noise figure of the DUT. You do not have to repeat any of the preliminary
steps (activation, calibration ...) if you wish to measure several DUTs using the same channel settings.
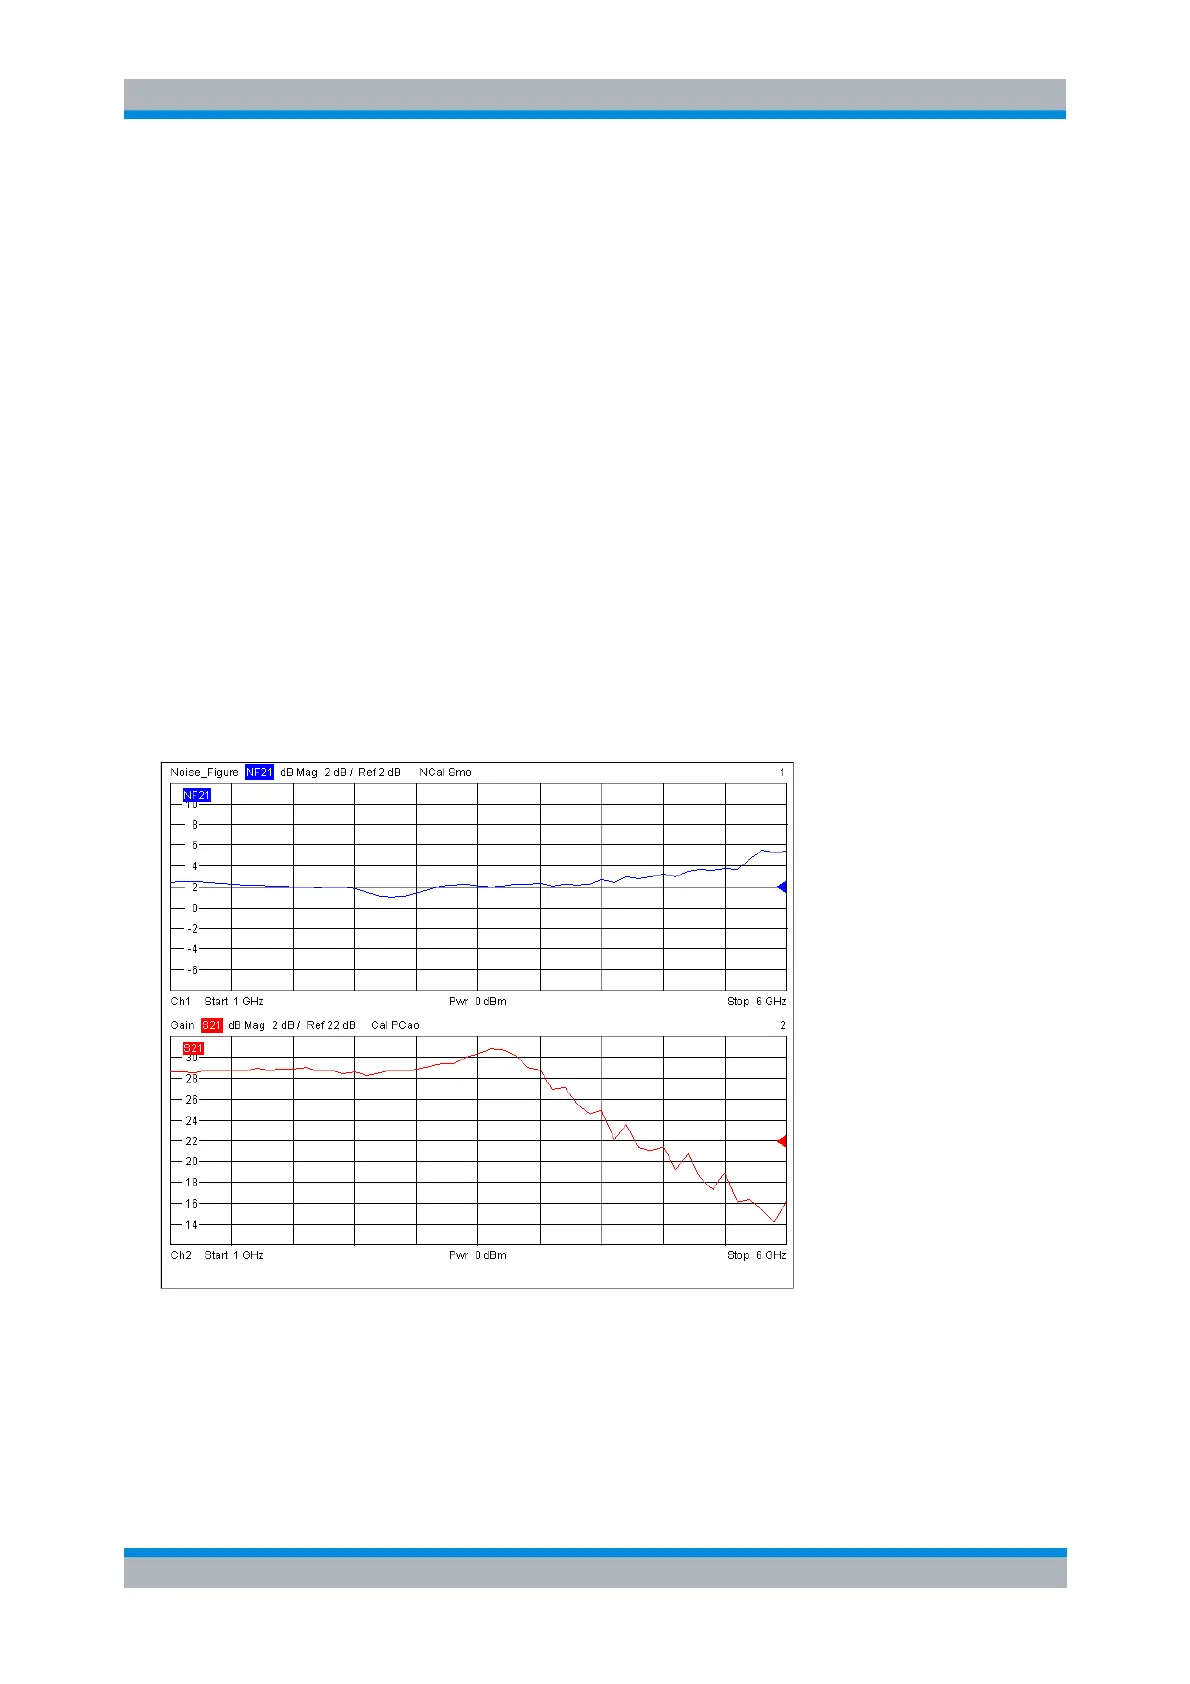
The figure below shows the noise figure and gain of a 3 dB amplifier. For convenience, the two traces
Trc1 and Trc2 were renamed Noise_Figure and Gain, respectively. The second trace was assigned to a
second channel.