R&S
®
ZVA / R&S
®
ZVB / R&S
®
ZVT GUI Reference
Trace Menu
Operating Manual 1145.1084.12 – 30 148
Unwrapped Phase
Selects a Cartesian diagram with an arbitrarily scaled linear vertical axis to display the phase of the
measured quantity.
Properties: The stimulus variable appears on the horizontal axis, scaled linearly. The phase of the
complex quantity C, i.e. φ (C) = arctan ( Im(C) / Re(C) ), appears on the vertical axis. φ (C) is measured
relative to the phase at the start of the sweep (reference phase = 0°). In contrast to the normal Phase
format, the display range is not limited to values between –180° and +180°. This avoids artificial jumps of
the trace but can entail a relatively wide phase range if the sweep span is large.
Application: Phase measurements, e.g. phase distortion, deviation from linearity.
After changing to the Unwrapped Phase format, use Trace – Scale – Autoscale to re-scale the vertical
axis and view the entire trace.
CALCulate<Chn>:FORMat UPHase
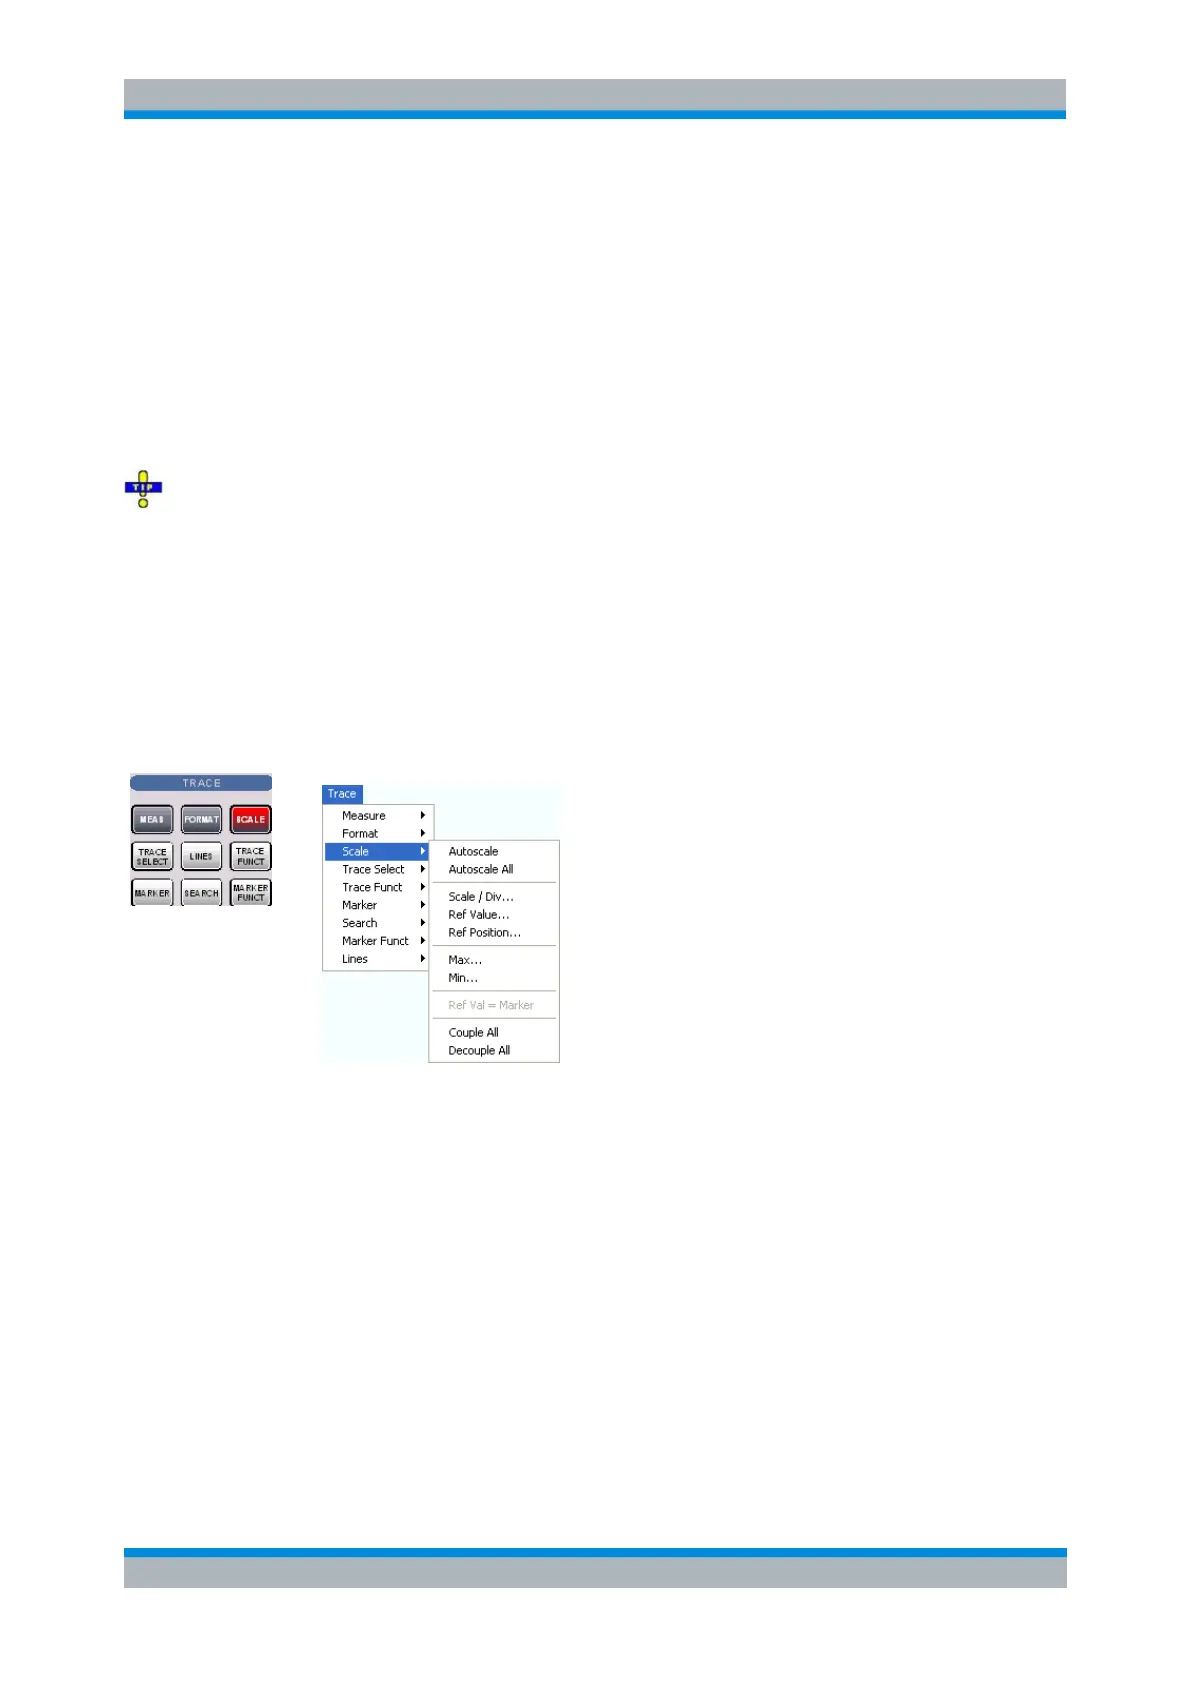
Scale
The Scale settings define how the active trace is presented in the diagram selected in the Format
submenu.
Autoscale adjusts the diagram scale in order to display the entire active trace in the diagram area.
Autoscale All adjusts the diagram scale in order to display all traces in the diagram area.
Scale/Div. sets the value of the vertical diagram divisions.
Ref. Value sets the reference line of a Cartesian diagram or the outer circumference of a polar
diagram.
Ref. Position defines the position of the reference line in a Cartesian diagram.
Max and Min define the upper and lower edge of a Cartesian diagram.
Ref Val = Marker sets the reference value equal to the active marker value.
Couple All / Decouple All select common or independent scale settings for all traces in the active
diagram area.
The Scale settings are closely related to the settings in the Format submenu and in the Display menu. All
of them have an influence on the way the analyzer presents data on the screen.