R&S
®
ZVA / R&S
®
ZVB / R&S
®
ZVT GUI Reference
Trace Menu
Operating Manual 1145.1084.12 – 30 139
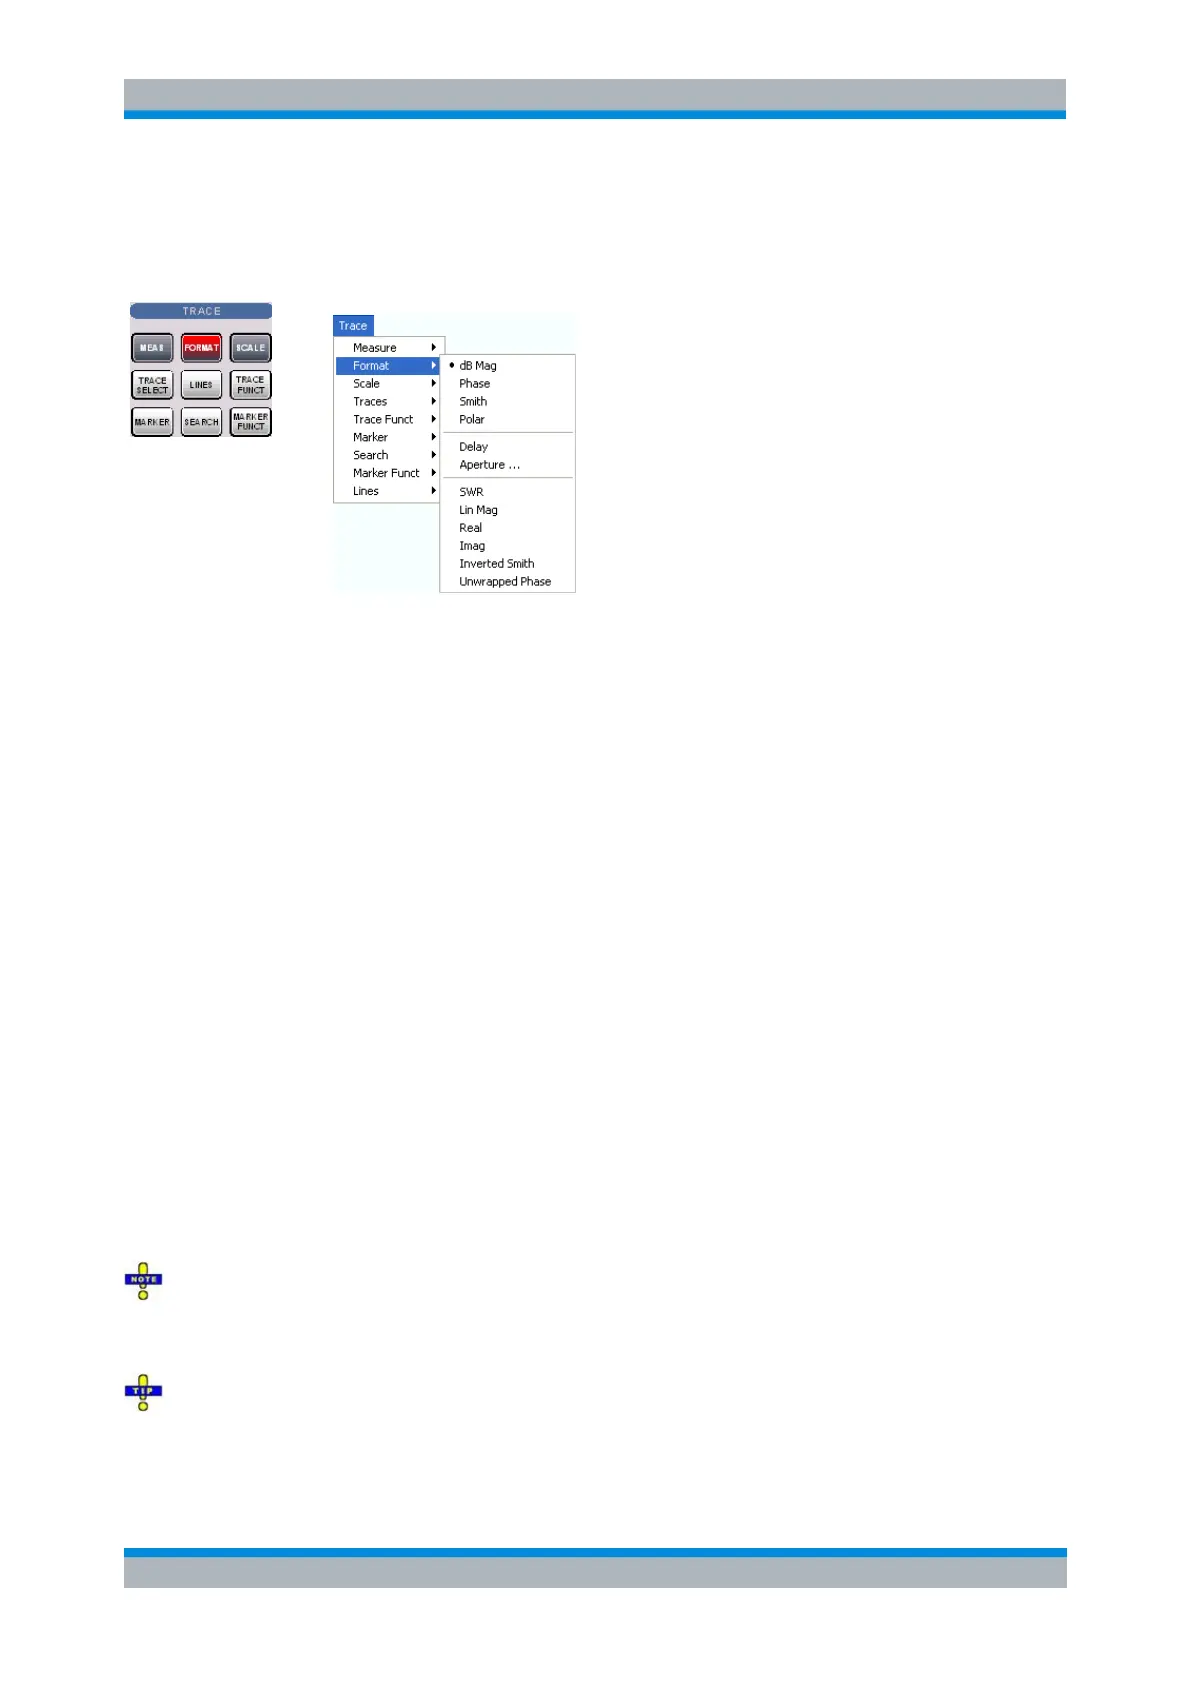
Format
The Format submenu defines how the measured data is presented in the graphical display.
dB Mag selects a Cartesian diagram with a logarithmic scale of the vertical axis to display the
magnitude of a complex measured quantity.
Phase selects a Cartesian diagram with a linear vertical axis to display the phase of a complex
measured quantity in the range between –180 degrees and +180 degrees.
Smith selects a Smith diagram to display an S-parameter or ratio.
Polar selects a polar diagram to display an S-parameter or ratio.
Delay calculates the group delay from an S-parameter or ratio and displays it in a Cartesian
diagram.
Aperture sets a delay aperture for the delay calculation.
SWR calculates the Standing Wave Ratio from the measured reflection S-parameters and
displays it in a Cartesian diagram.
Lin Mag selects a Cartesian diagram with a linear scale of the vertical axis to display the
magnitude of the measured quantity.
Real selects a Cartesian diagram to display the real part of a complex measured quantity.
Imag selects a Cartesian diagram to display the imaginary part of a complex measured quantity.
Inverted Smith selects an inverted Smith diagram to display an S-parameter or ratio.
Unwrapped Phase selects a Cartesian diagram with a linear vertical axis to display the phase of
the measured quantity in an arbitrary phase range.
The Format settings are closely related to the settings in the Scale submenu and in the Display menu. All
of them have an influence on the way the analyzer presents data on the screen.
The analyzer allows arbitrary combinations of display formats and measured quantities (Trace –
Measure). Nevertheless, in order to extract useful information from the data, it is important to select a
display format which is appropriate to the analysis of a particular measured quantity; see Measured
Quantities and Display Formats.
An extended range of formats is available for markers. To convert any point on a trace, create
a marker and select the appropriate marker format. Marker and trace formats can be applied
independently.