R&S
®
ZVA / R&S
®
ZVB / R&S
®
ZVT System Overview
Screen Elements
Operating Manual 1145.1084.12 – 30 36
Auto activates the default step size for the current input parameter.
Close closes the Step Size dialog.
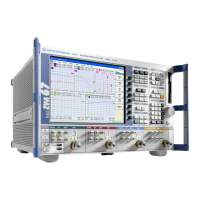
Paste Marker List
A pull-down list symbol next to a numeric input field opens a list of all current stimulus and response
marker values of the active trace. Any of the marker values can be selected as a numeric entry. If the
physical unit of the selected marker value is inconsistent (mismatch of stimulus and response values) then
the numeric value is used without the unit.
The response values in the paste marker list are not updated as the analyzer continues measuring, so
they may differ from the values in the marker info field.
To open the paste marker list you can also click on the input field and use the space bar of your
keyboard or the checkmark key in the NAVIGATION keypad at the front panel of the analyzer.
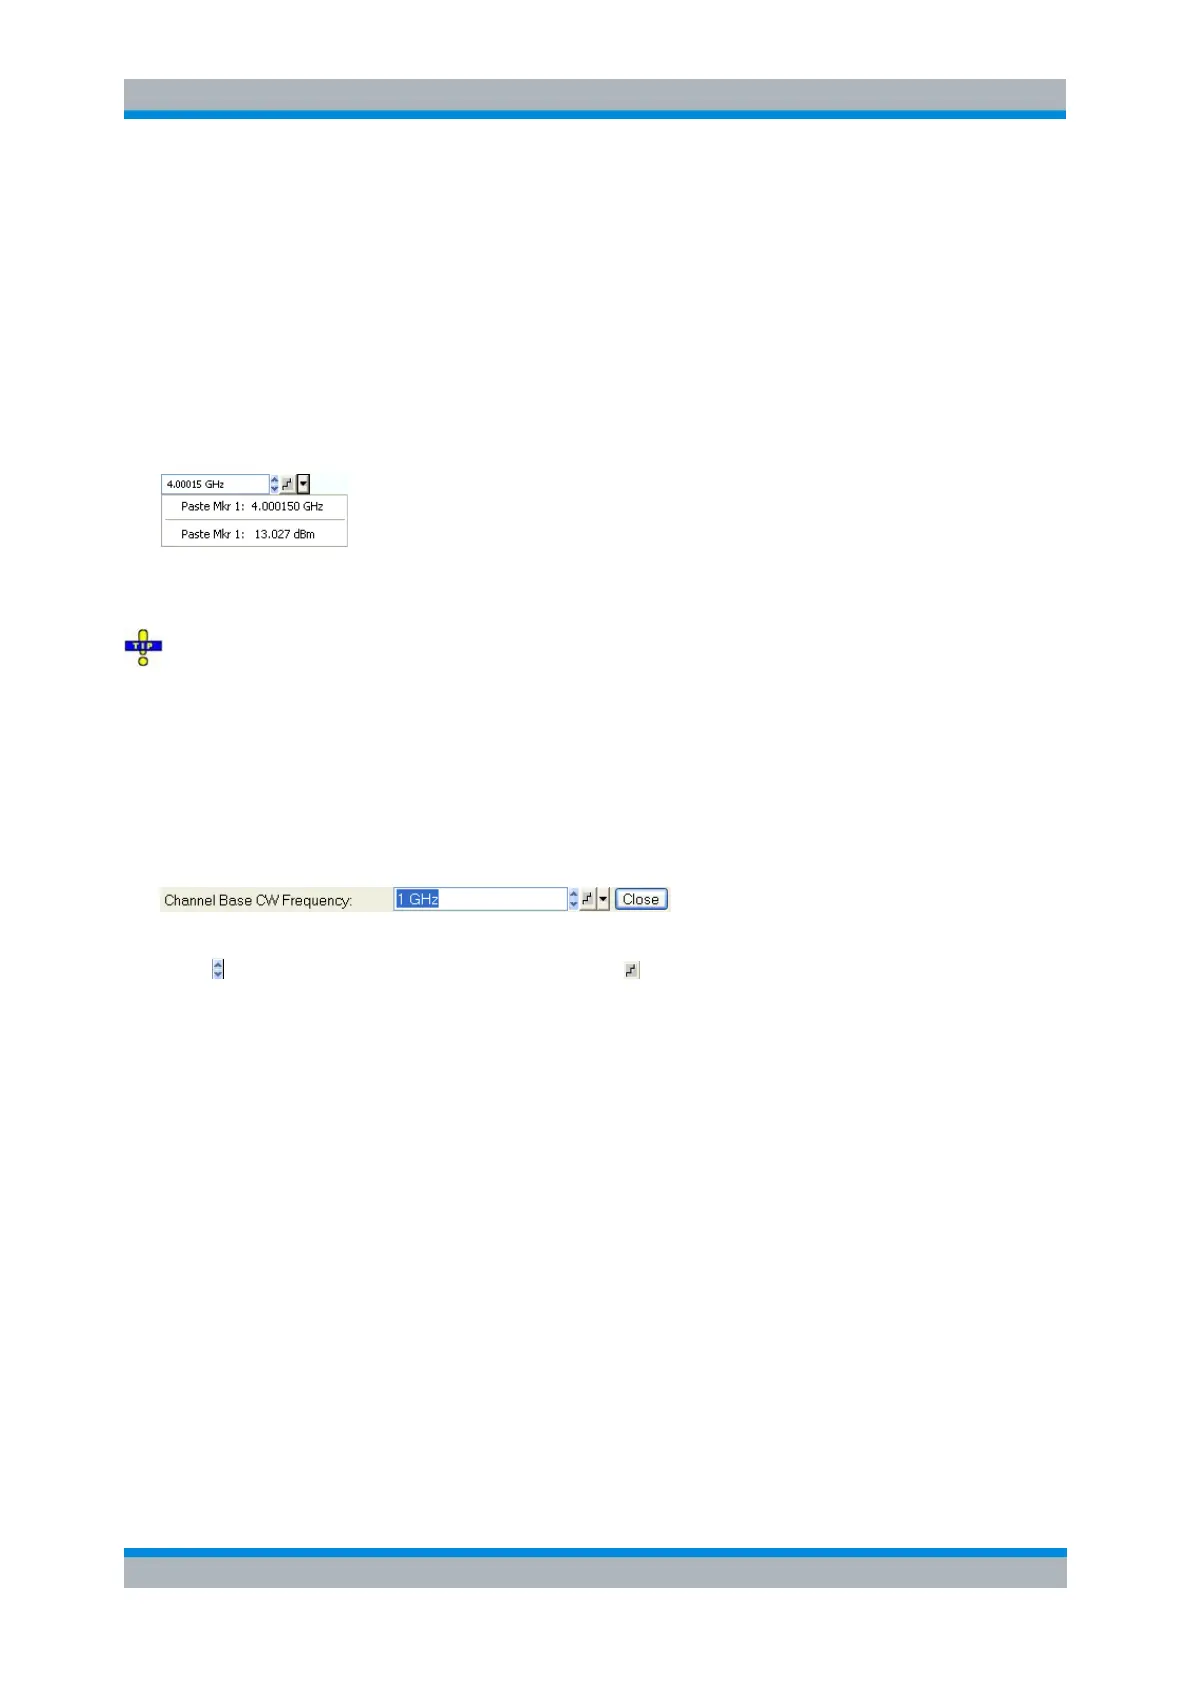
Numeric Entry Bar
Single numeric values can be entered using the input field of the numeric entry bar. The numeric entry bar
appears just below the menu bar as soon as a function implying a single numeric entry is activated. In
contrast to dialogs, it does not hide any of the display elements in the diagram area.
The numeric entry bar contains the name of the calling function, a numeric input field including the Cursor
Up/Down buttons for data variation and a step symbol , and a Close button. Besides it is closed
automatically as soon as an active display element in the diagram area is clicked or a new menu
command is activated.
Display Formats and Diagram Types
A display format defines how the set of (complex) measurement points is converted and displayed in a
diagram. The display formats in the Trace – Format menu use the following basic diagram types:
Cartesian (rectangular) diagrams are used for all display formats involving a conversion of the
measurement data into a real (scalar) quantity, i.e. for dB Mag, Phase, Delay, SWR, Lin Mag,
Real, Imag and Unwrapped Phase.
Polar diagrams are used for the display format Polar and show a complex quantity as a vector in a
single trace.
Smith charts are used for the display format Smith. They show a complex quantity like polar
diagrams but with grid lines of constant real and imaginary part of the impedance.
Inverted Smith charts are used for the display format Inverted Smith. They show a complex
quantity like polar diagrams but with grid lines of constant real and imaginary part of the
admittance.