R&S
®
ZVA / R&S
®
ZVB / R&S
®
ZVT System Overview
Screen Elements
Operating Manual 1145.1084.12 – 30 38
An extended range of formats and conversion formulas is available for markers. To convert any point
on a trace, create a marker and select the appropriate marker format. Marker and trace formats can be
selected independently.
Polar Diagrams
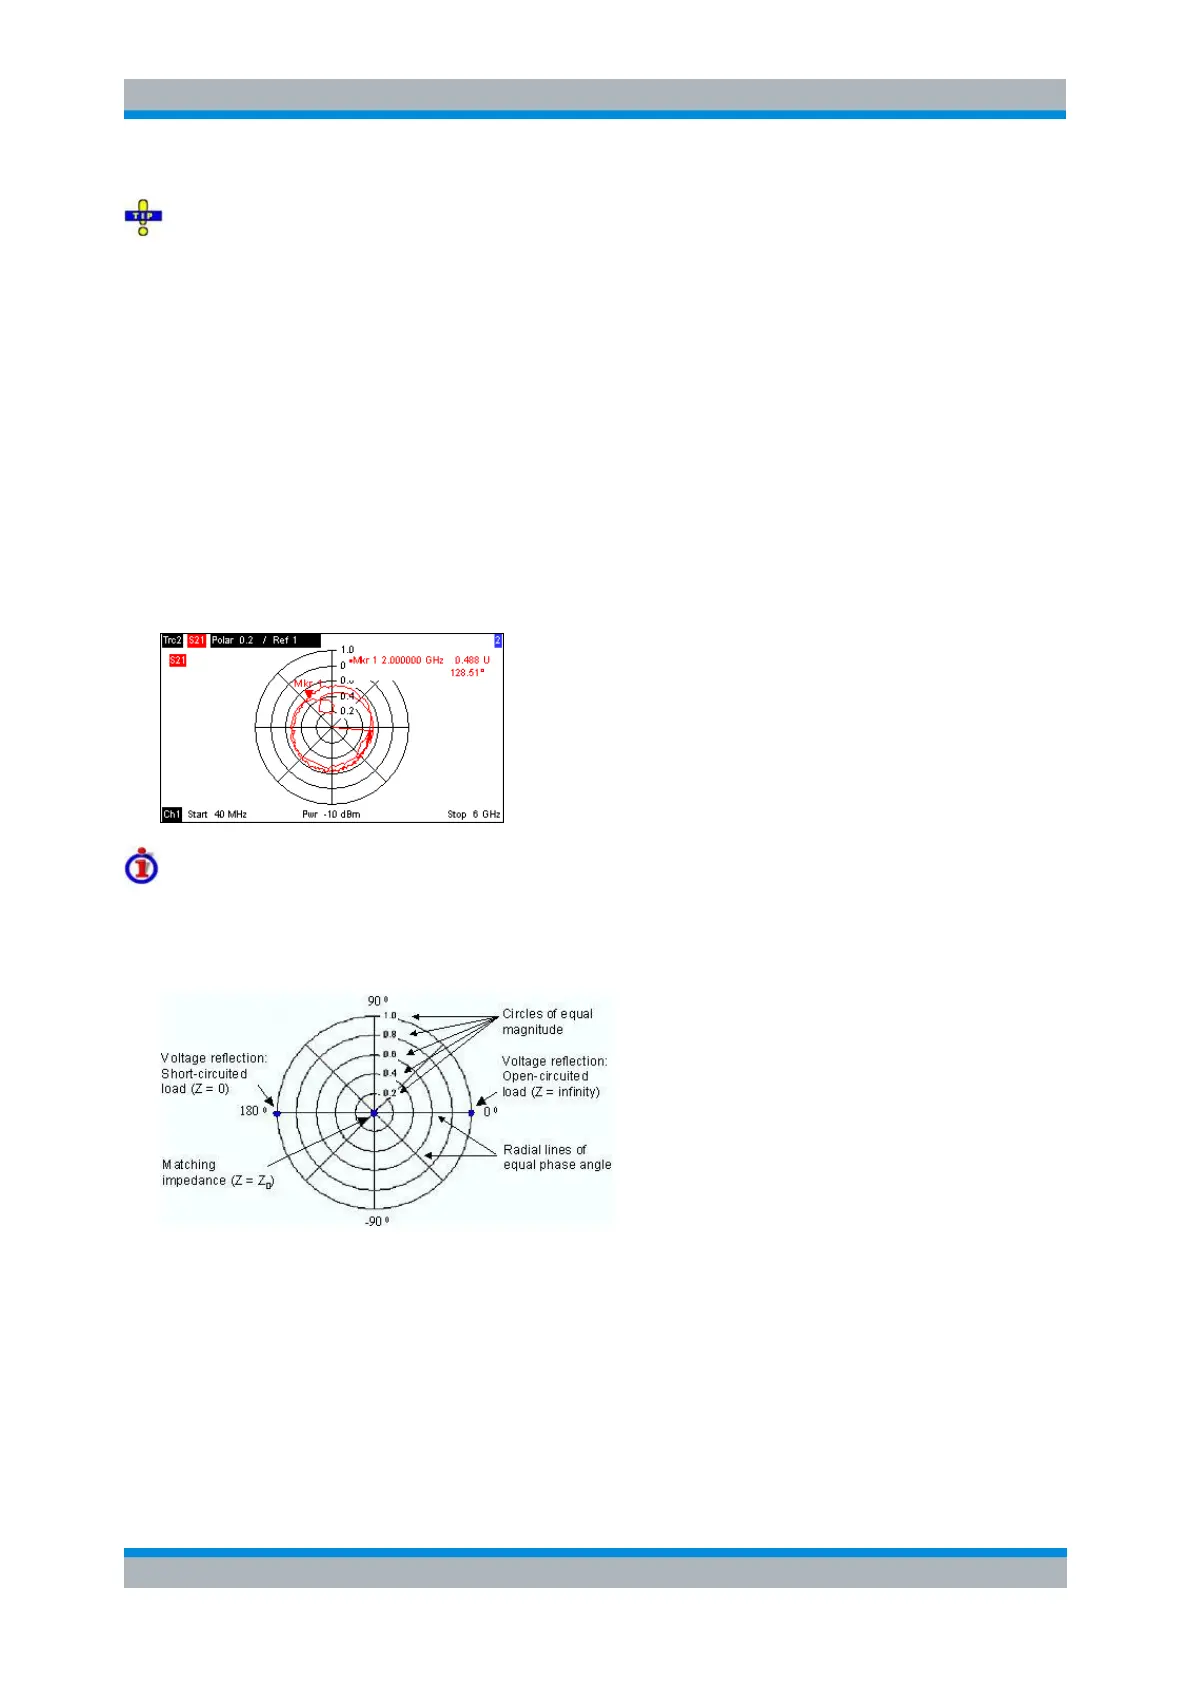
Polar diagrams show the measured data (response values) in the complex plane with a horizontal real
axis and a vertical imaginary axis. The grid lines correspond to points of equal magnitude and phase.
The magnitude of the response values corresponds to their distance from the center. Values with
the same magnitude are located on circles.
The phase of the response values is given by the angle from the positive horizontal axis. Values
with the same phase are on straight lines originating at the center.
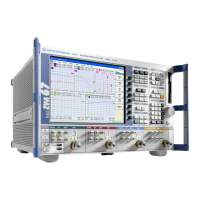
The following example shows a polar diagram with a marker used to display a pair of stimulus and
response values.
Example: Reflection coefficients in polar diagrams
If the measured quantity is a complex reflection coefficient (S
11
, S
22
etc.), then the center of the polar
diagram corresponds to a perfect load Z
0
at the input test port of the DUT (no reflection, matched input),
whereas the outer circumference (|S
ii
| = 1) represents a totally reflected signal.
Examples for definite magnitudes and phase angles:
The magnitude of the reflection coefficient of an open circuit (Z = infinity, I = 0) is one, its phase is
zero.
The magnitude of the reflection coefficient of a short circuit (Z = 0, U = 0) is one, its phase is –180
deg.