4
Life Science Applications
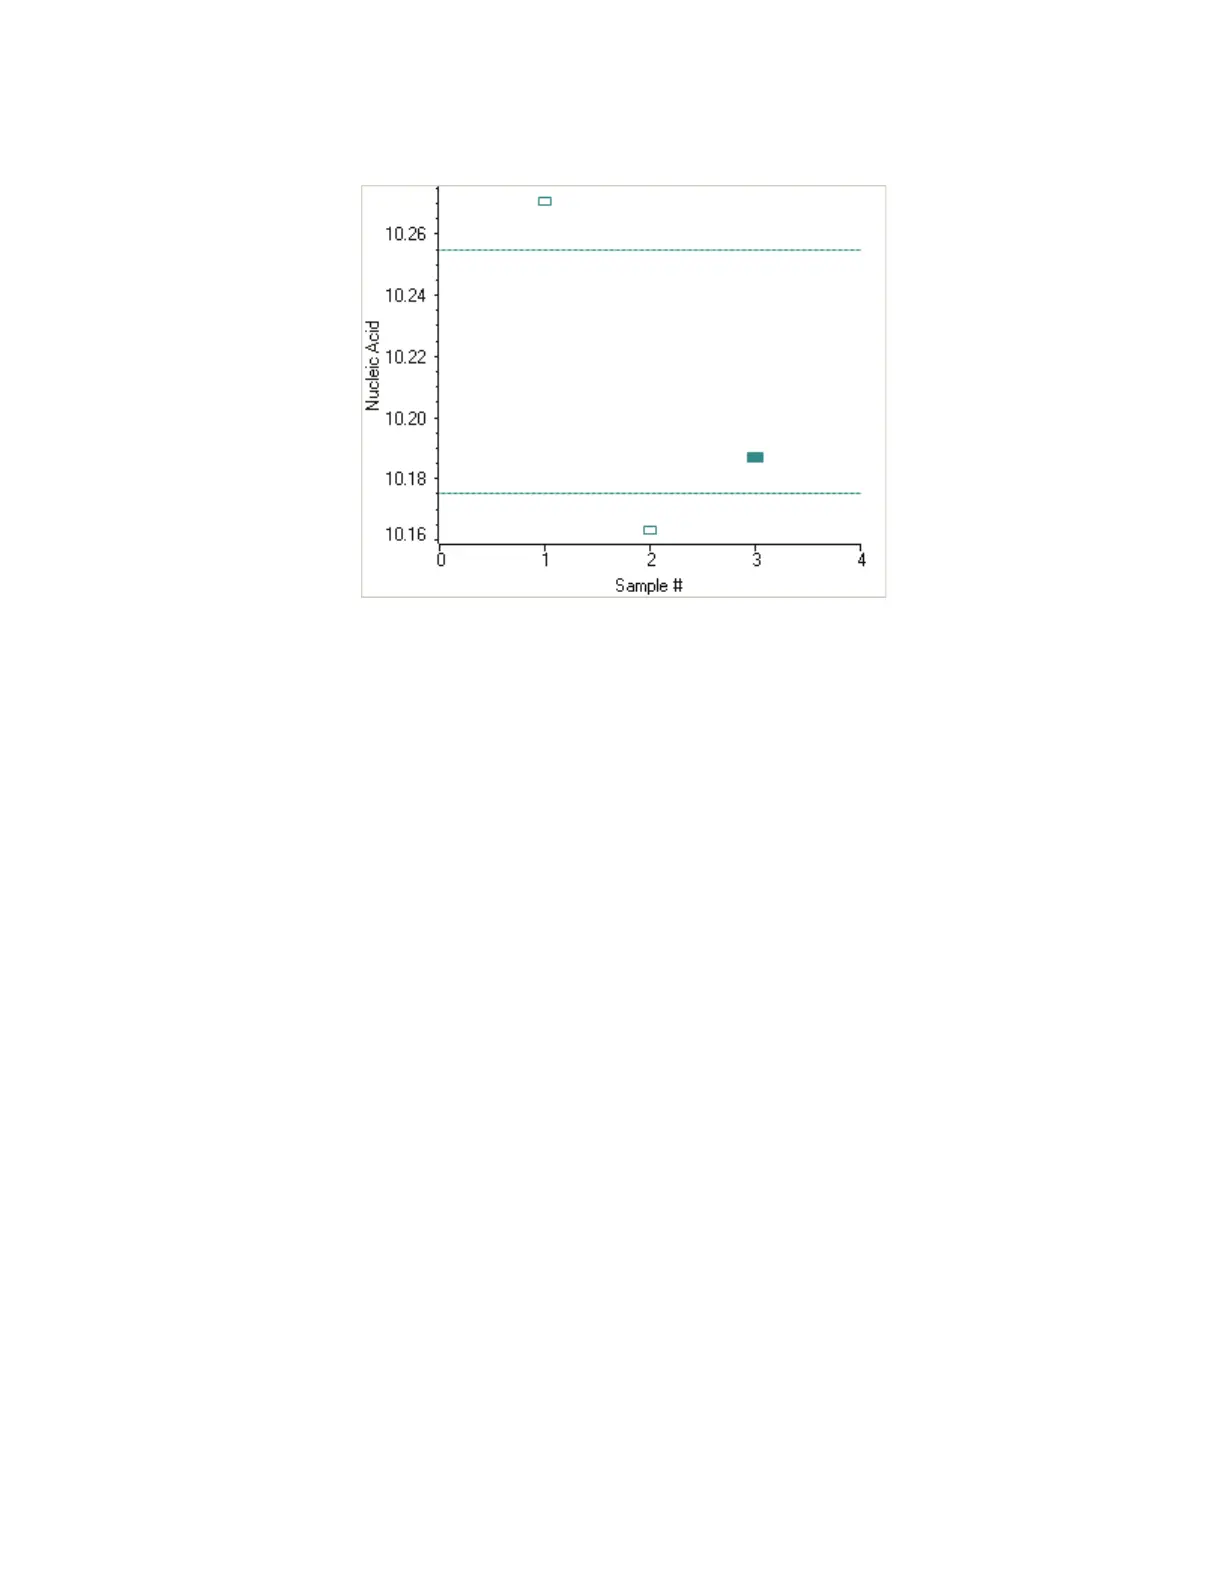
Nucleic Acid Labels
158 Evolution 200 Series User Guide Thermo Scientific
To copy this plot, right-click it and choose Copy to Clipboard.
The Data tab displays the acquired data (a fixed data point or scan spectrum) for the
sample selected in the table. (Right-click the data to access commands for customizing the
display, including adding annotation. See Data Display for more information.)
The table contains the columns of information specified on the Configuration tab in
Reports. Examples include sample identification, user name, and the results of replicate,
duplicate or triplicate measurements and their standard deviation.
To measure a sample again, right-click its row in the results table and choose Remeasure.
After the remeasurement, the previous information for the sample is crossed out (but not
removed from the table).
Related Topics
Overview
Dye/Chromophore Editor
Application Settings
Unique Screen Features
Data Display
Oligo Calculator
After the Measurement
• When using the cuvette option, remove the cuvette, rinse thoroughly and dry between
samples.