2
INSIGHT Software
Operation
Thermo Scientific Evolution 200 Series User Guide 93
3. Click OK.
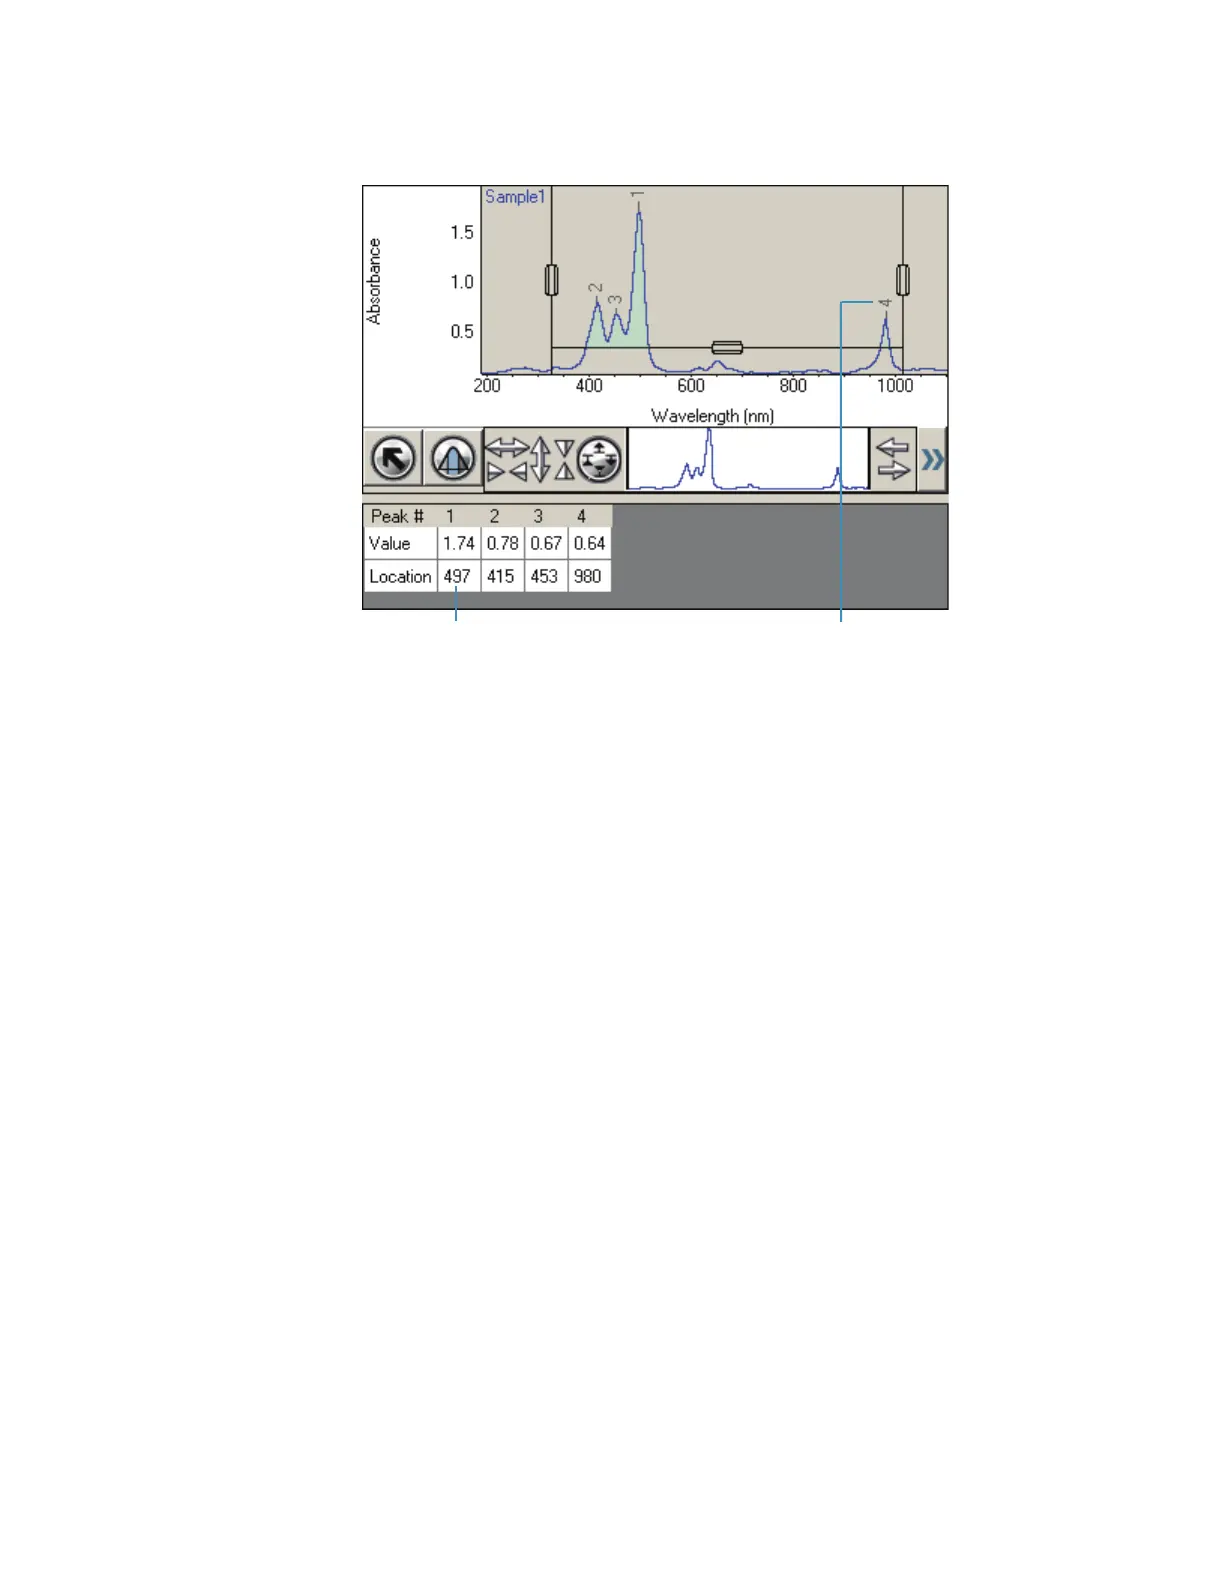
The found peaks have labels, and the peak results are listed at the right.
The settings are saved in the workbook and will be used for measuring samples with
Result on the Measurement tab set to Peak Pick.
Related Topics
Smoothing Scan Data
Converting Scan Data to a Derivative
Converting Scan Data to Other Units
Adding Two Scan Spectra
Subtracting a Scan Spectrum
Ratioing Two Scan Spectra
Averaging Scan Spectra
Adding, Subtracting, Multiplying or Dividing Scan Data by a Factor
Finding Value Level Crossings in Scan Data
Finding Value Level Crossings in Scan Data
Use Value Level in the Analyze menu to find the wavelengths where a spectrum crosses a
specified ordinate value.