2
INSIGHT Software
System Settings
100 Evolution 200 Series User Guide Thermo Scientific
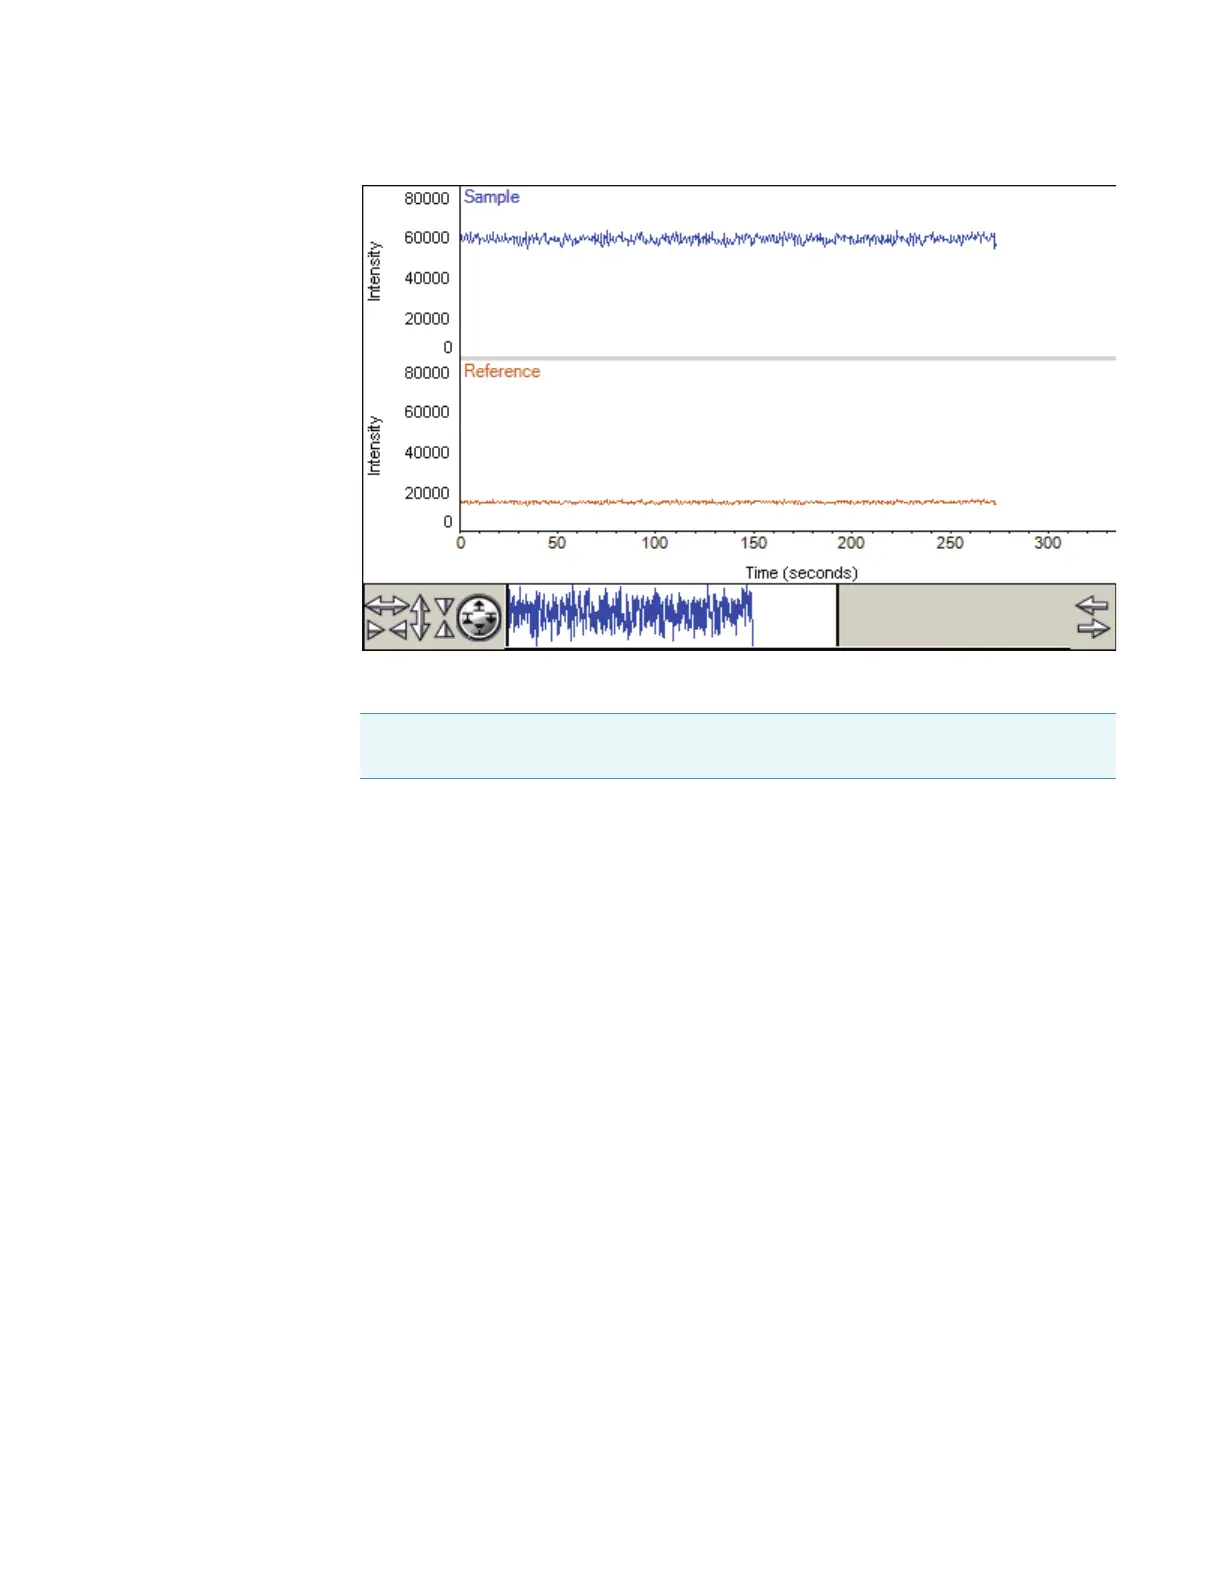
To overlay the plots instead of stacking them, deselect Stack.
The Time readout shows the elapsed time. Intensities can be measured and plotted for up
to 15 minutes without restarting the process.
If the plot of sample detector intensity is not at the desired position for viewing, adjust
the detector gain by dragging the Gain slider up or down.
To adjust the display, use the view finder. To zoom in, draw a box and click inside it. To
return to full display, double-click the pane.
4. Align the accessory to achieve the desired sample detector intensity (see Accessories).
5. When finished, click Stop.
Related Topics
Calibrations Tab
Lamp Tab
System Tab
Calibrations Tab
Use the Calibrations tab in System Settings to calibrate the instrument wavelength or
accessories. To calibrate using a particular lamp, click its Calibrate button and follow the
instructions that appear. See Mercury Lamp for instructions for using a mercury lamp safely.
Note If the instrument has variable slit wheels, the start of intensity measurement is
delayed while they move to their 2 nm position.