2
INSIGHT Software
Operation
Thermo Scientific Evolution 200 Series User Guide 75
Reports
A report contains a table of sample data and other specified information.
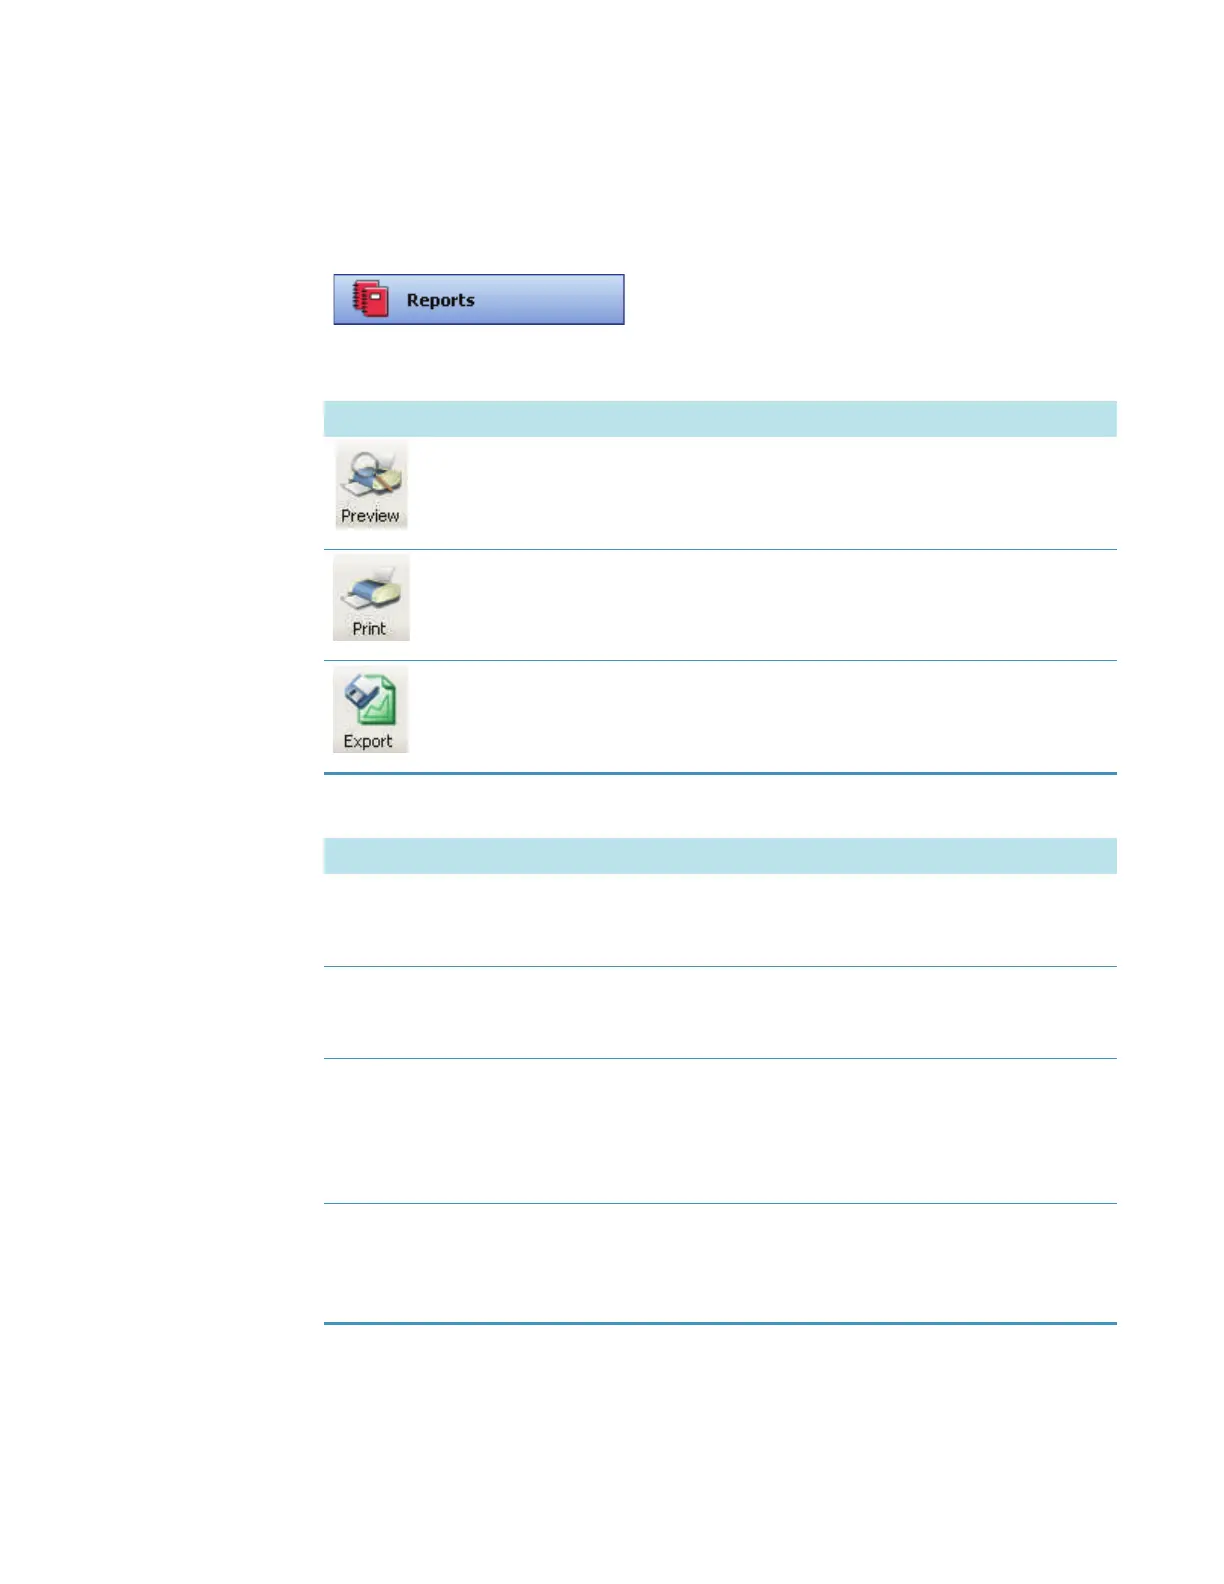
These action buttons appear in Reports:
The export formats include:
These tabs appear in the Reports right pane:
To configure or view the report after opening a
workbook or measuring a sample, click Reports.
Button Description
Shows the current report before printing, with the header and footer specified
on the Report Master Page tab in Options.
Prints the current report on the specified printer.
Saves the current report in the specified format (see the table below).
Format Description
Report, Excel XML
Spreadsheet (*.xml)
Can be opened in Excel®. Only the columns displayed in the
report are saved. Configure the report to display the desired
information before exporting.
Report, Tab Separated
Values (*.tsv)
Can be opened in Notepad or Excel. Only the columns
displayed in the report are saved. Configure the report to display
the desired information before exporting.
Wavelength Curve, Excel
XML Spreadsheet (*.xml)
Saves the absorbance values along with the corresponding
wavelengths for a highlighted sample. If multiple samples are
highlighted, the corresponding absorbance values for each
wavelength are saved onto separate worksheets within one Excel
file.
Wavelength Curve, Tab
Separated Values (*.tsv)
Saves absorbance values along with the corresponding
wavelengths for highlighted samples in a format that can be
opened in Notepad or Excel. Multiple samples are saved
sequentially in one column.