2
INSIGHT Software
Operation
Thermo Scientific Evolution 200 Series User Guide 63
Related Topics
Measurement Tab for Quant
Formulas and Units Tab
Performing a Quantitative Analysis
Standards Tab for Quant
PLoc(start, end,
baseline1, baseline2)
Corrects the spectrum with a two-point baseline and then report the
location (X-axis value) at which the maximum Y-axis value occurs
between two spectral limits.
PWidth(start, end,
percent)
Determines the peak width between two spectral limits. Report the
width at which the peak reaches a specified percentage of the peak
maximum.
Pavg(start, end) Determines the average value of the spectrum between two spectral
limits.
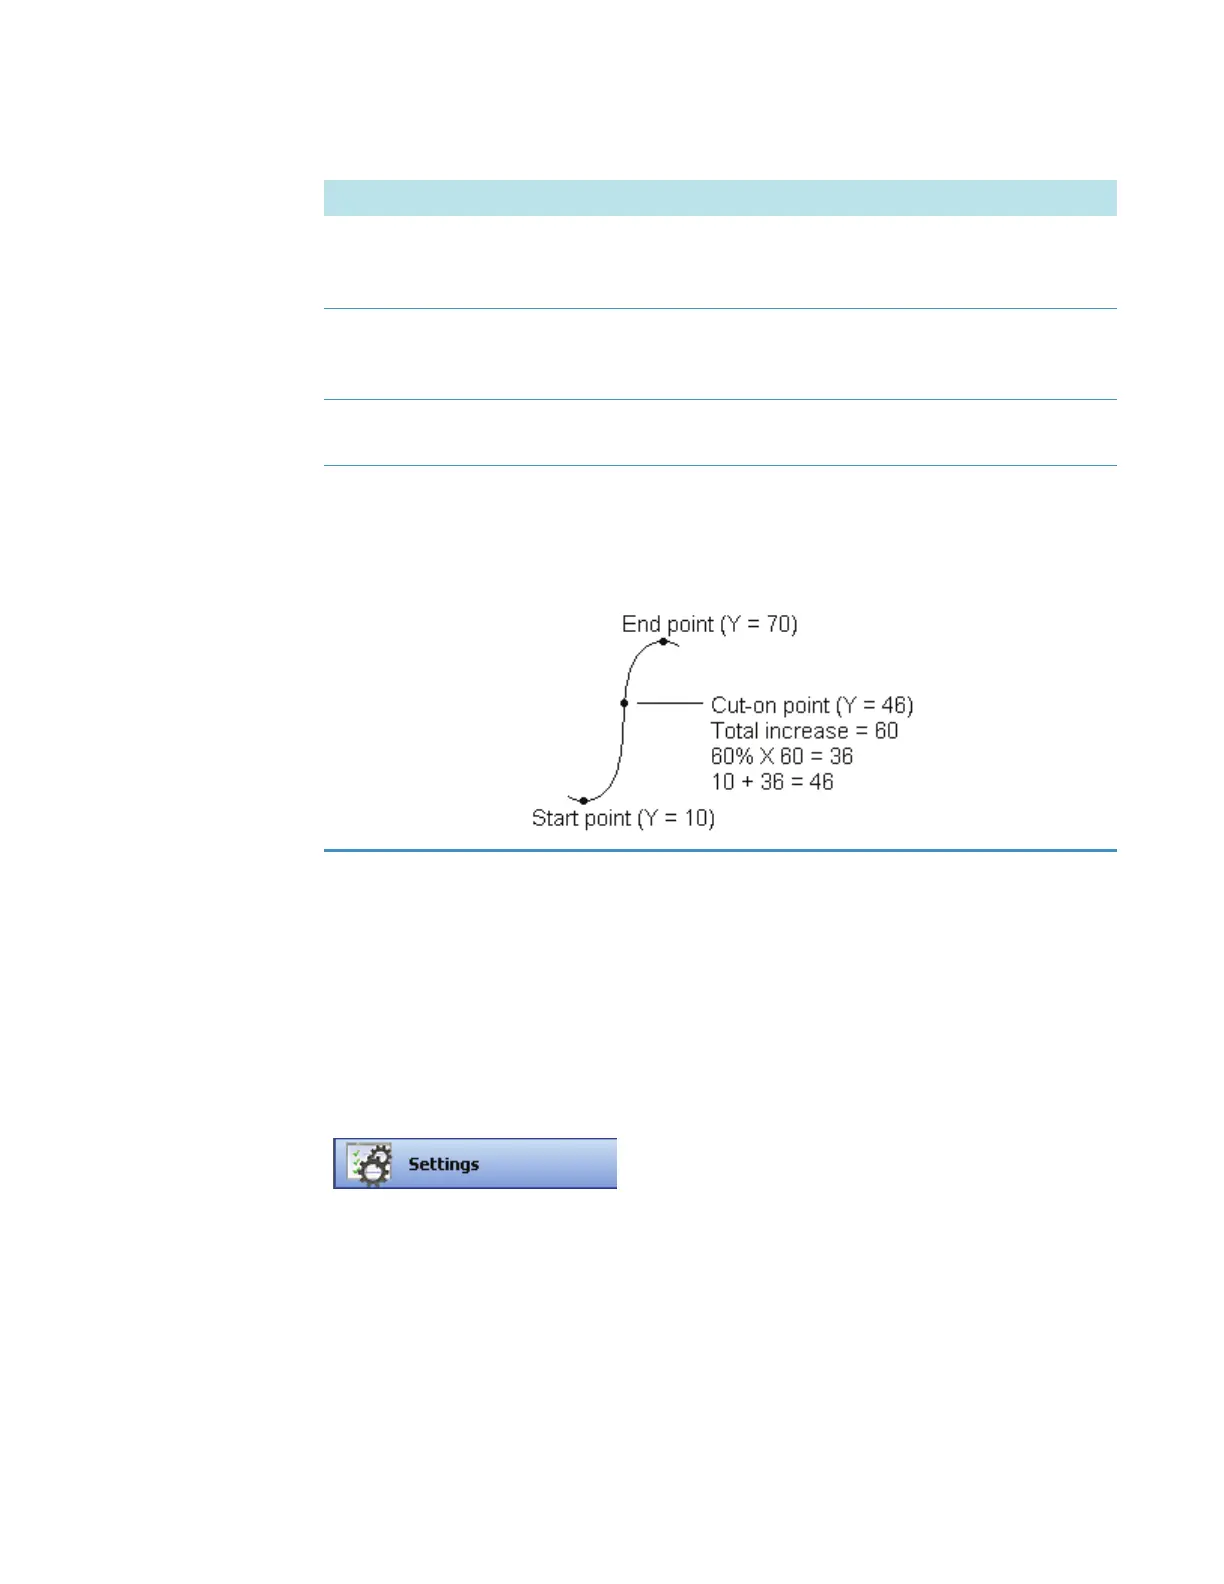
Pcut(start, end,
percent)
Determines the location (X-axis value) of the cut-on or cut-off point
in the specified spectral region. For example, for a region with
increasing Y value, a cut-on point occurs where the increase reaches
the specified percentage of total increase across the region. Here is an
example showing a cut-on point with “percent” set to 60:
To display the Standards tab in the right pane, click
Settings in Quant and then set Quant Type to Standard
curve, Standard curve with two wavelengths, or
Advanced standard curve.
Function Returned or Performed by Function