Measurement Examples Example 8: Profiling Pulse Signals
ML2437A/38A OM/PM PN: 10585-00001 Rev. P 7-21
To display the Measurement screen, press any hard key.
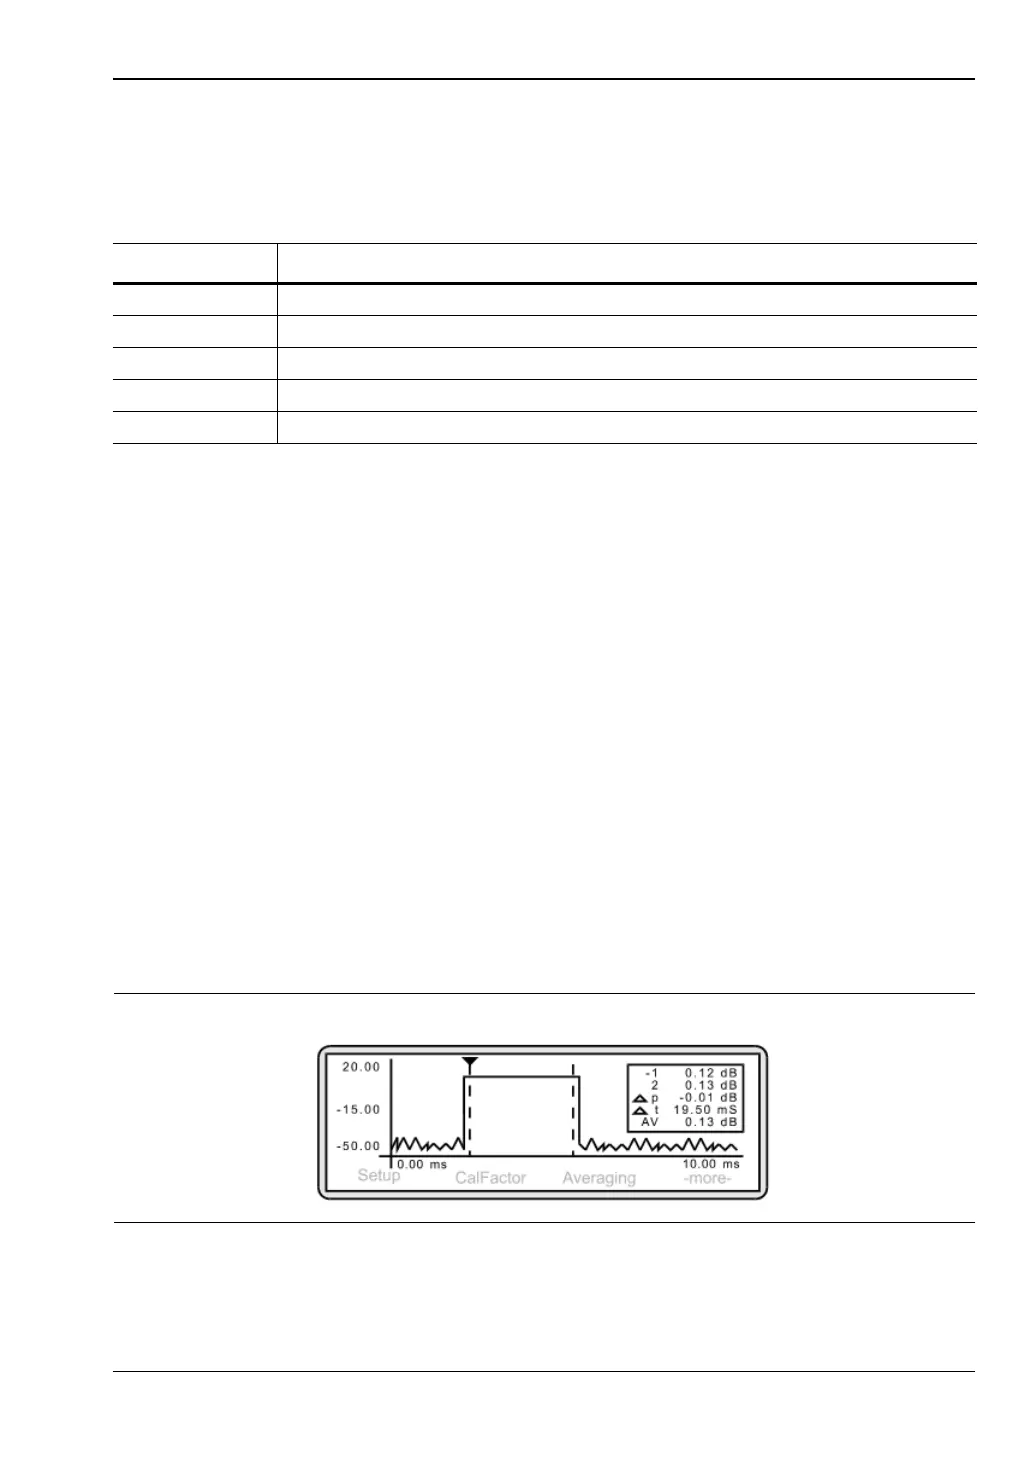
The pulse is displayed on the screen and the display readout box on the right-hand side
shows:
3. Changing the axis scaling
In order to display the waveform clearly, it may be necessary to amend the X and Y axis
settings. To change the time axis, press [System]
> [Profile] > [Period].
The entered value of Data Collection Period determines the time axis scaling. Using the
keypad, input a period value that will result in the display of the required number of
pulses. Press either [ms.Enter] or [us.Enter]. In this example, a period of 10 ms will
result in the display of one pulse cycle. To change the power axis, press [System]
>
[Control]
> [-more-] > [SCALE].
Press [TOP] and/or [BOTTOM] to set the dB values as required. Press [Enter] to accept
the values. Alternatively, rather than entering top and bottom values, you can select
[AUTO SCALE].
4. Introducing a delay to the trigger point display.
The Measurement screen currently shows the trigger point of the pulse as occurring on
the extreme left-hand side of the graph. It may be useful to show a leading edge to the
pulse thus displaying activity prior to the trigger point.
Press [System]
> [Profile] > [Delay]
and using the keypad, input a delay of 9.5 ms. Press [Enter] to accept the value. The
Measurement screen now shows activity prior to the trigger point.
Table 7-3. Display Meanings
Item Meaning
1 the power measurement at cursor 1
2 the power measurement at cursor 2
p the power difference between cursors 1 and 2
t the time difference between cursors 1 and 2
AV the average power between cursors 1 and 2
Figure 7-33.