DRAFT
September 1, 2004 11:39 am, CH_End-Point.fm
Chapter 5 Analyzing End-Point Data
5-8 Applied Biosystems 7900HT Fast Real-Time PCR System and SDS Enterprise Database User Guide
Cluster Variations
The SDS software graphs the results of an allelic discrimination run on a scatterplot
contrasting reporter dye fluorescence (Allele X R
n
versus Allele Y R
n
). The software
represents each well of the 384-well plate as a datapoint on the plot. The clustering of
these datapoints can vary along the horizontal axis (Allele X), vertical axis
(Allele Y), or diagonal (Allele X/Allele Y). This variation is due to differences in the
extent of PCR amplification, which could result from differences in initial DNA
concentration.
The example below shows the variation in clustering due to differences in the extent
of PCR amplification.
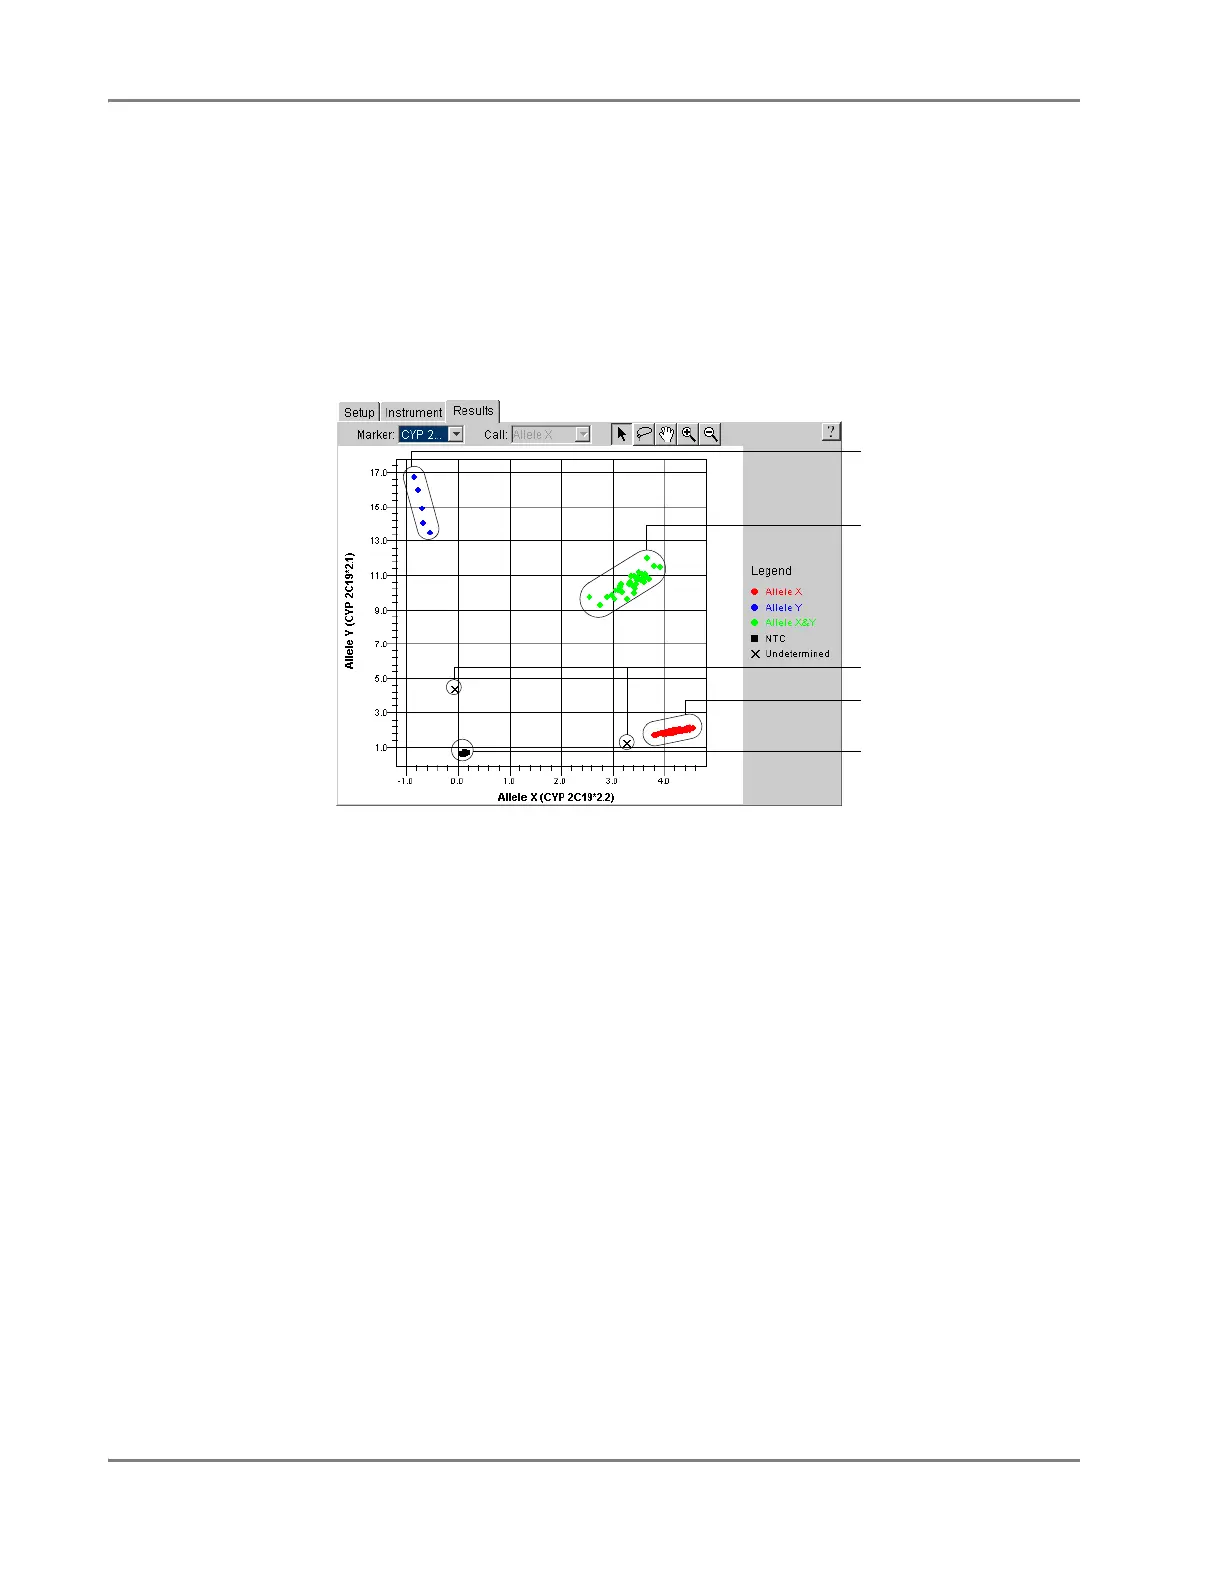
Figure 5-4 Common Datapoint Clusters
Genotypic Segregation of Datapoint Clusters
Figure 5-4 illustrates the concept of genotypic segregation of samples within the
allele plot. The plot contains four separate, distinct clusters that represent the No
Template Controls and the three possible genotypes (allele X homozygous, allele Y
homozygous, and heterozygous). Because of their homogenous genetic compliment,
homozygous samples exhibit increased fluorescence along one axis of the plot
(depending on the allele they contain). In contrast, heterozygous samples appear
within the center of the plot because they contain copies of both alleles, and therefore
exhibit increased fluorescence for both reporter dyes.
About Outliers
Samples that did not cluster tightly may:
• Contain rare sequence variations
• Contain sequence duplications
• Not contain a crucial reagent for amplification (the result of a pipetting error)
Allele Y homozygotes
Allele X/Allele Y
heterozygotes
Allele X homozygotes
No amplification
Outliers