DRAFT
September 1, 2004 11:39 am, CH_Real-Time.fm
Analyzing the Study
Applied Biosystems 7900HT Fast Real-Time PCR System and SDS Enterprise Database User Guide 6-27
• Manual Ct – Instructs the software to use the baseline and threshold values
specified in the Analysis Settings dialog box to calculate C
T
s for the selected
detectors.
The software provides two methods for manually setting the baseline and
threshold values for the detector:
– If you know the values that you want to use, enter them into the appropriate
fields of the Analysis Settings dialog box.
– If you want to set the baseline and threshold using the controls of the
Amplification Plot tab, leave the fields empty and set the values later as
described on page 6-46.
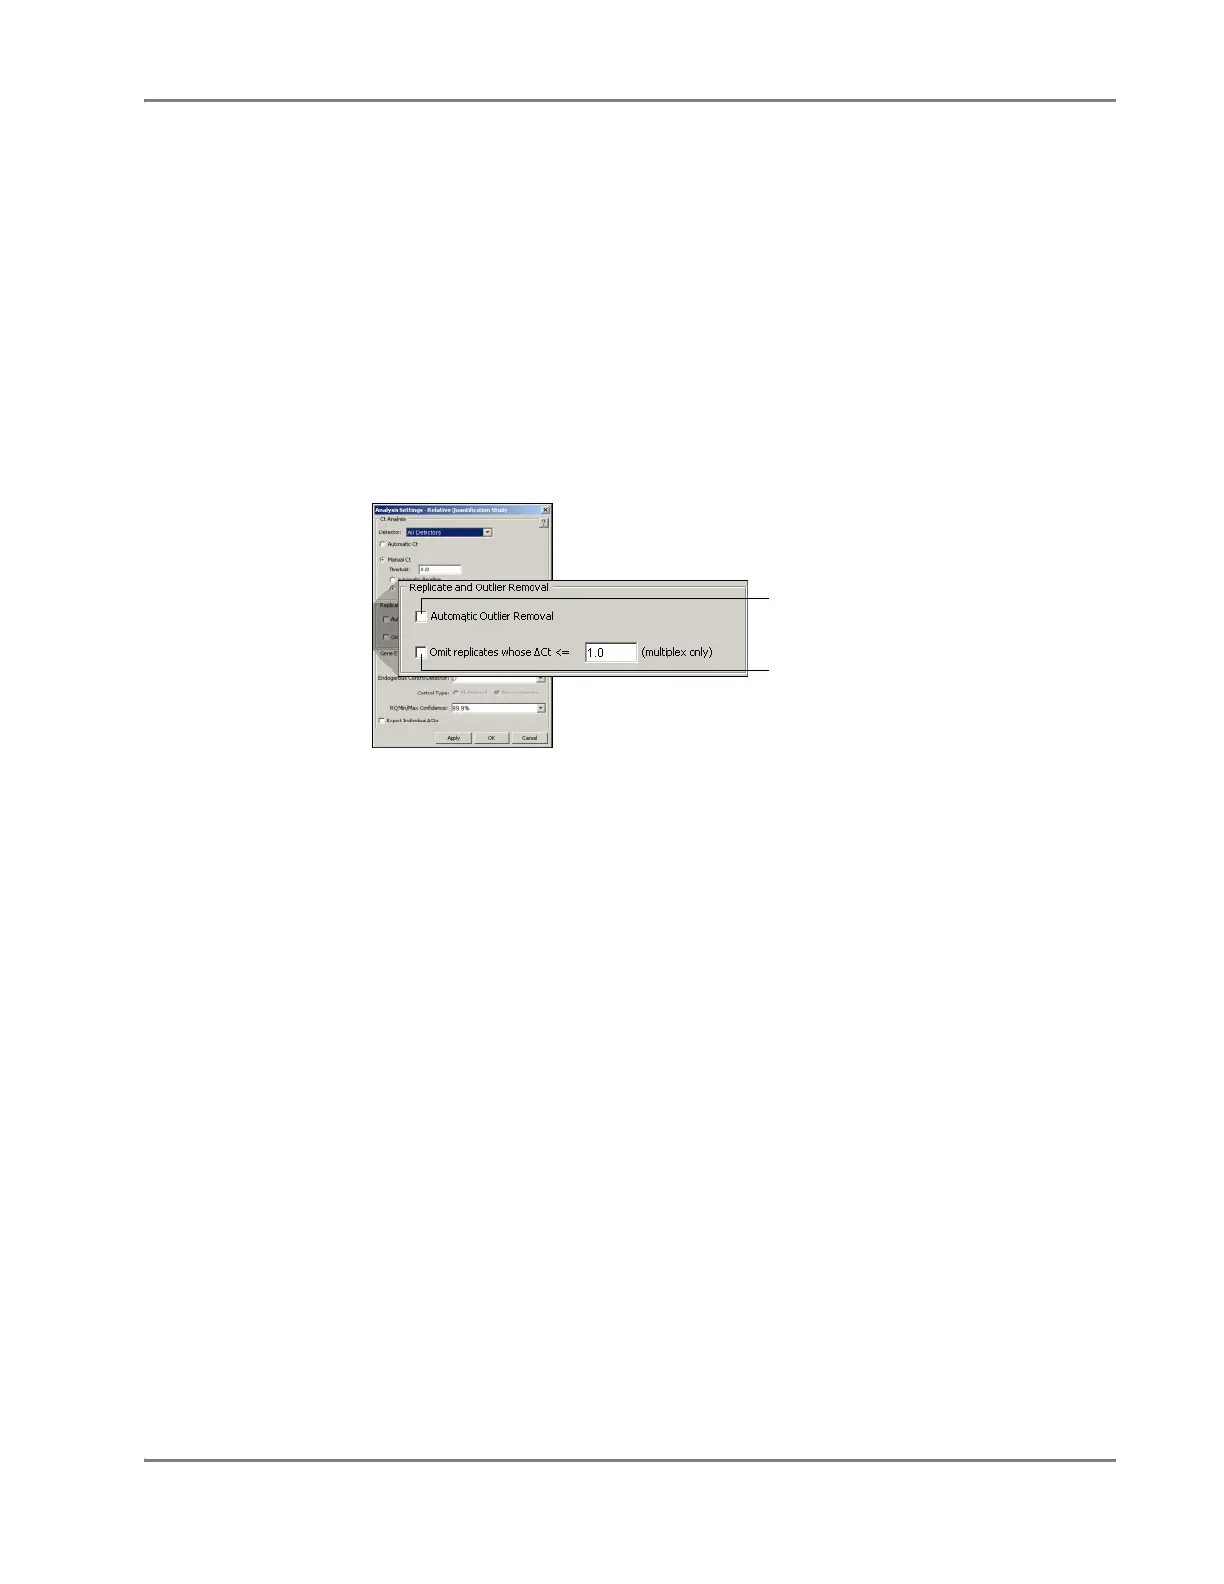
Replicate and
Outlier Removal
for Study Settings
The settings of this group box determine how the software identifies and removes
outlier data for all detectors in the study.
Figure 6-10 Replicate and Outlier Removal for Study Settings
• Automatic Outlier Removal – Instructs the software to automatically remove
the data of outlying replicate wells using the outlier removal algorithm. See
“Automatic Outlier Removal” on page 6-19 for an explanation of the algorithm.
• Omit replicates whose ∆C
T
<=… – Instructs the software to remove from the
analysis, the data of any sample well whose ∆C
T
is less than the number of
cycles specified in the associated field. This option is only available for
multiplex experiments where similar target and endogenous control C
T
s may
indicate that competition of the assays is affecting the amplification.
Note: You can also identify and eliminate outliers manually, as explained in
“Eliminating Outlying Amplification” on page 6-49.
Automatic Outlier
Removal check box
Omit replicates whose ∆C
T
<=…
check box