5-4
2(Union) .... Fills all areas where the conditions of the
graphed inequalities are satisfied.
This is the initial default.
• Pressing !f(FORMAT) while the graph relation list screen or graph screen displays
a dialog box that you can use to change the graph line style and graph line color. For
details, see “Changing Graph Properties” (page 5-15).
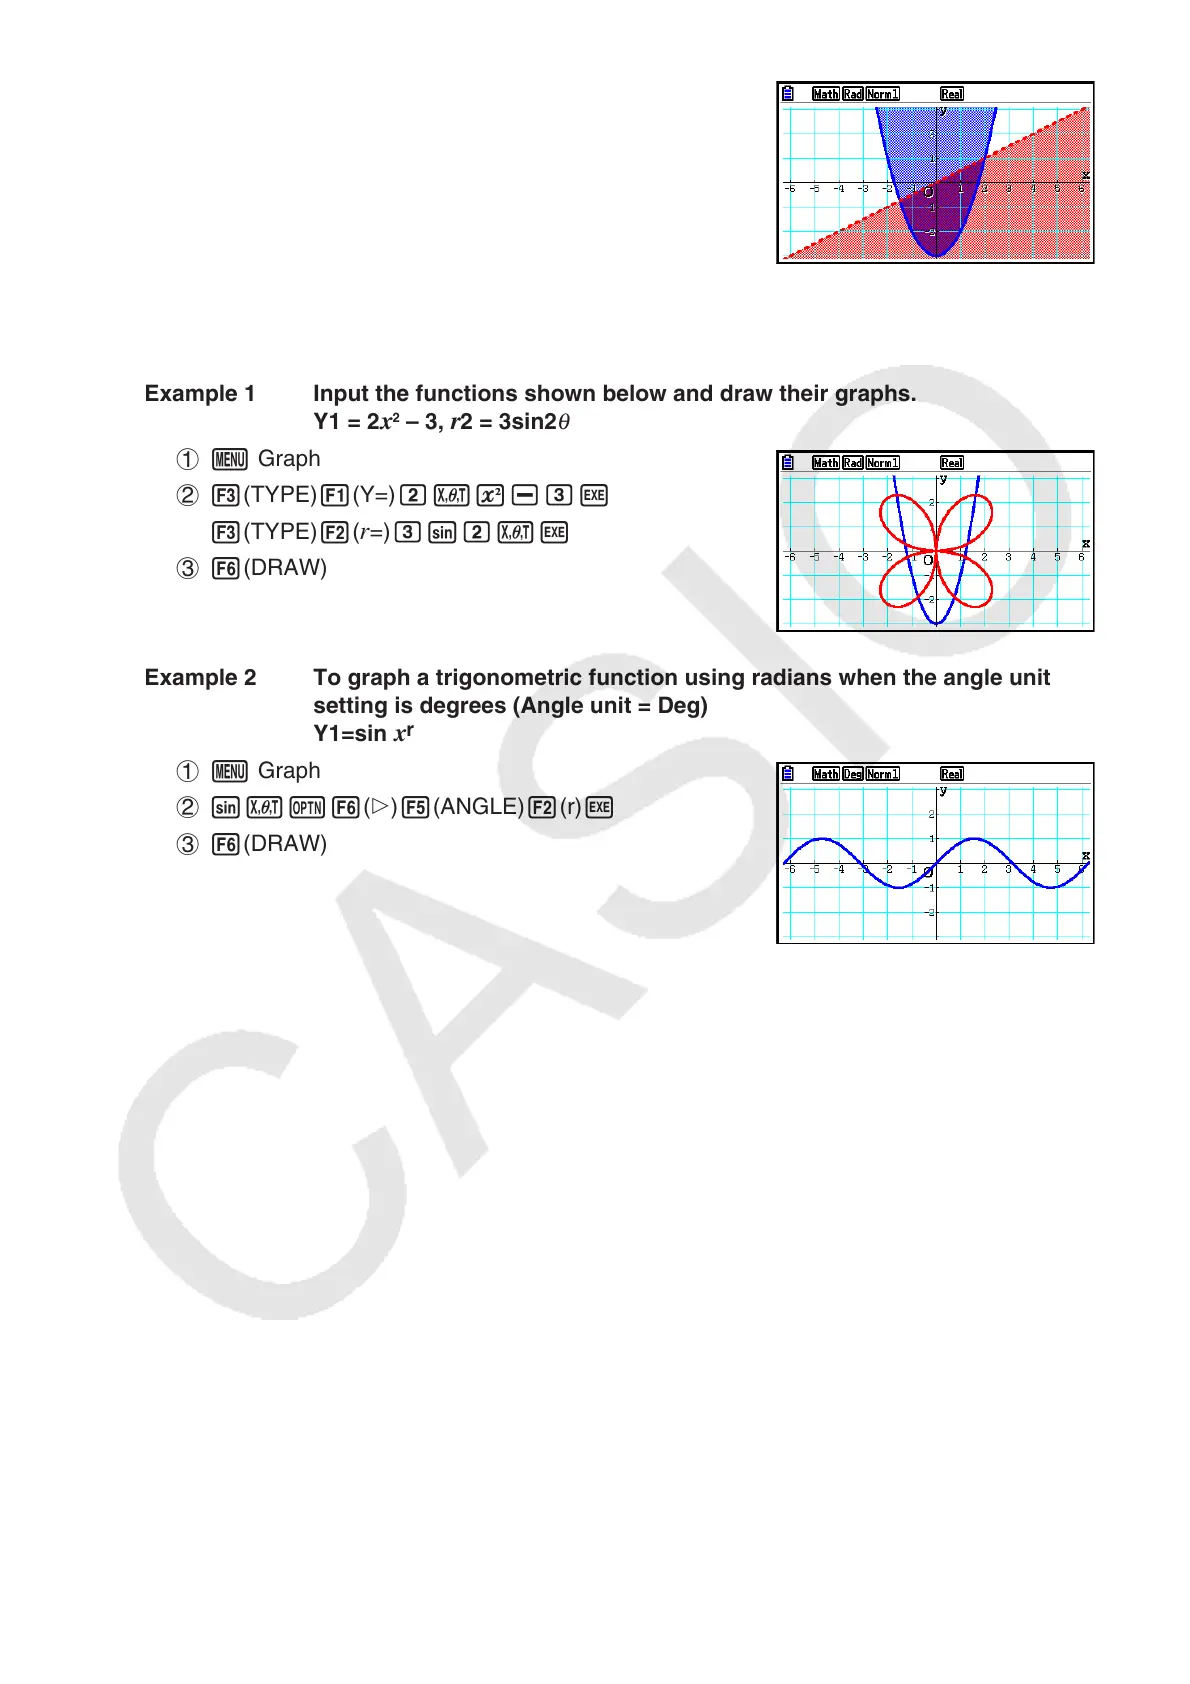
Example 1 Input the functions shown below and draw their graphs.
Y1 = 2
x
2
– 3, r2 = 3sin2
θ
1 m Graph
2 3(TYPE)1(Y=)cvx-dw
3(TYPE)2(
r=)dscvw
3 6(DRAW)
Example 2 To graph a trigonometric function using radians when the angle unit
setting is degrees (Angle unit = Deg)
Y1=sin
x
r
1 m Graph
2 svK6(g)5(ANGLE)2(r)w
3 6(DRAW)

 Loading...


