6-26
• Power Regression ..........................
• Sin Regression ...............................
• Logistic Regression ........................
u Estimated Value Calculation for Regression Graphs
The Statistics mode also includes a Y-CAL function that uses regression to calculate the
estimated y -value for a particular x -value after graphing a paired-variable statistical
regression.
The following is the general procedure for using the Y-CAL function.
1. After drawing a regression graph, press !5(G-SOLVE) 1(Y-CAL) to enter the graph
selection mode, and then press w.
If there are multiple graphs on the display, use f and c to select the graph you want,
and then press w.
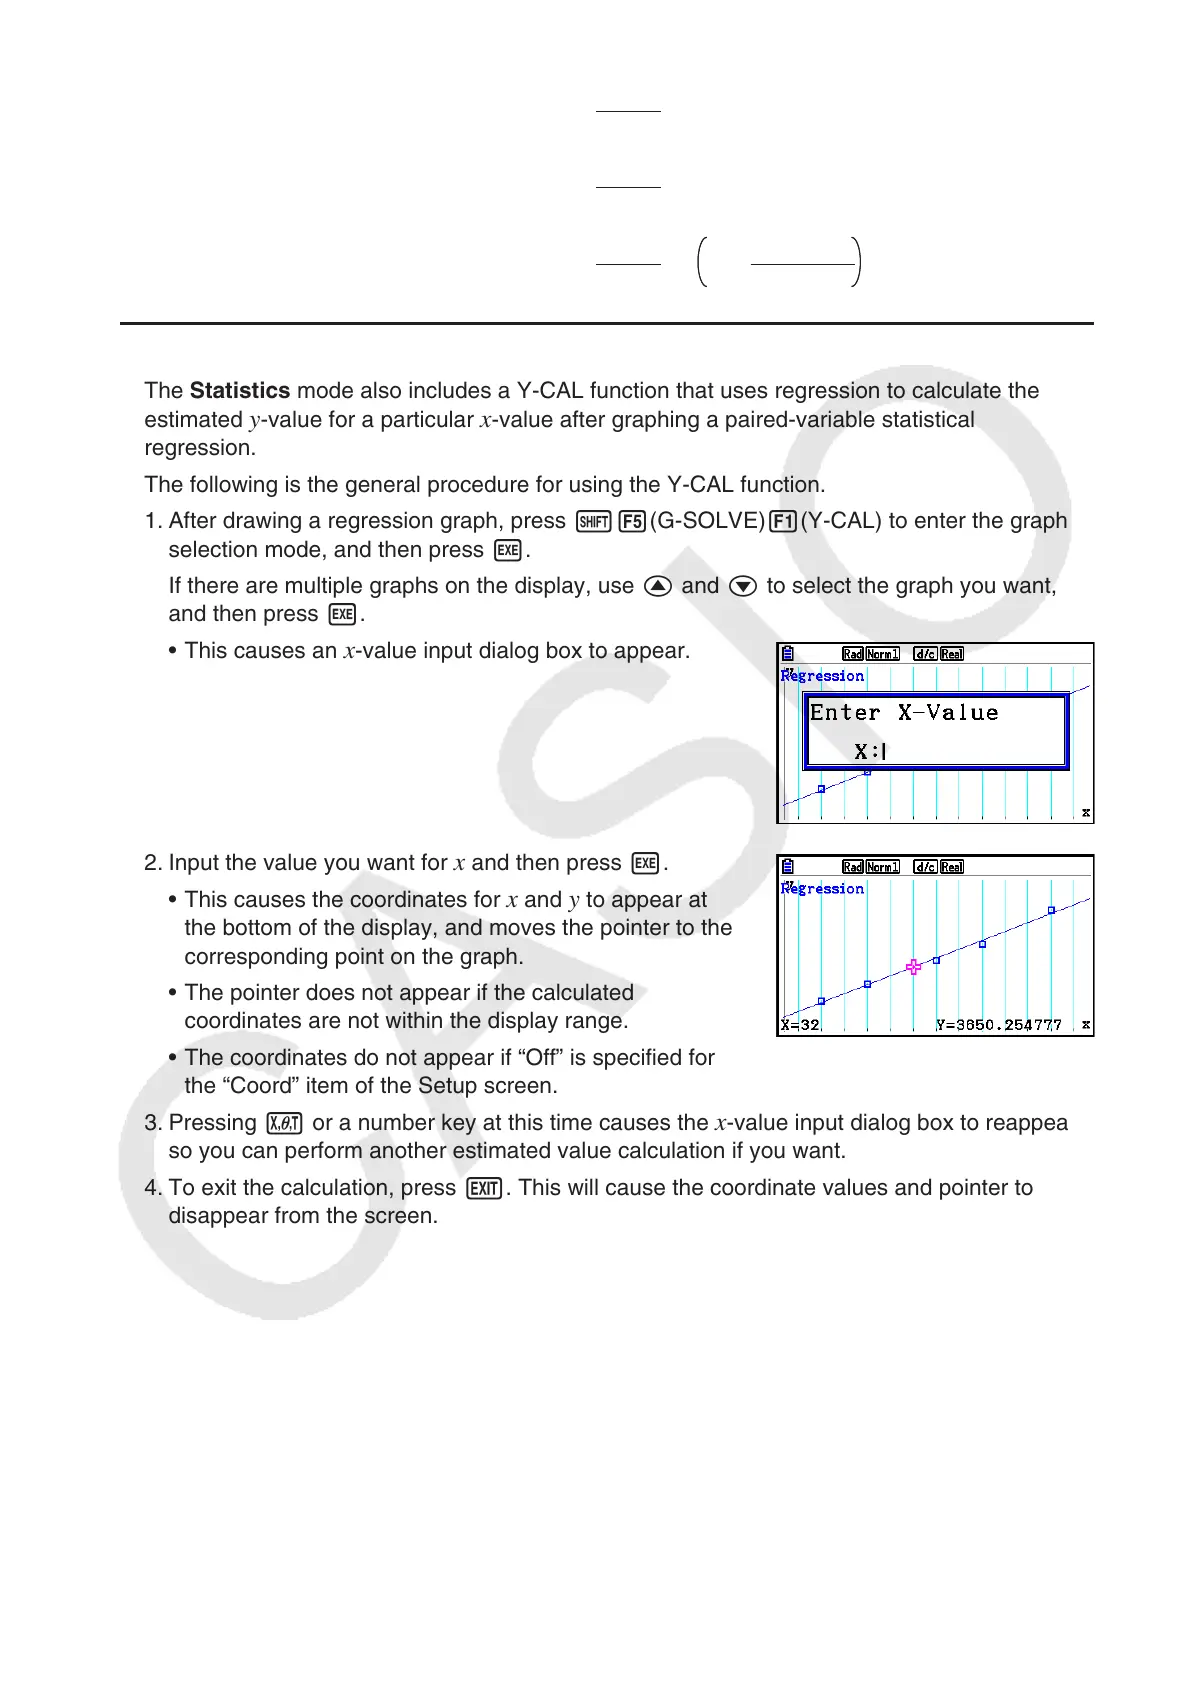
• This causes an
x -value input dialog box to appear.
2. Input the value you want for x and then press w.
• This causes the coordinates for
x and y to appear at
the bottom of the display, and moves the pointer to the
corresponding point on the graph.
• The pointer does not appear if the calculated
coordinates are not within the display range.
• The coordinates do not appear if “Off” is specified for
the “Coord” item of the Setup screen.
3. Pressing v or a number key at this time causes the
x-value input dialog box to reappear
so you can perform another estimated value calculation if you want.
4. To exit the calculation, press J. This will cause the coordinate values and pointer to
disappear from the screen.
Se =
Σ
1
n – 2
i=1
n
(ln y
i
– (ln a + b ln x
i
))
2
Se =
Σ
1
n – 2
i=1
n
(ln y
i
– (ln a + b ln x
i
))
2
Se =
Σ
1
n – 2
i=1
n
(yi – (a sin (bxi + c) + d ))
2
Se =
Σ
1
n – 2
i=1
n
(yi – (a sin (bxi + c) + d ))
2
Se =
Σ
1
n – 2 1 + ae
–bx
i
C
i=1
n
y
i
–
2
Se =
Σ
1
n – 2 1 + ae
–bx
i
C
i=1
n
y
i
–
2

 Loading...


