8-38
k Using Distribution Graphs in a Program
Special commands are used to draw distribution graphs in a program.
• To draw a normal cumulative distribution graph
DrawDistNorm <Lower>, <Upper> [,
σ
, ]
Population mean *
1
Population standard deviation *
1
Data upper limit
Data lower limit
*
1
This can be omitted. Omitting these items performs the calculation using = 1 and = 0.
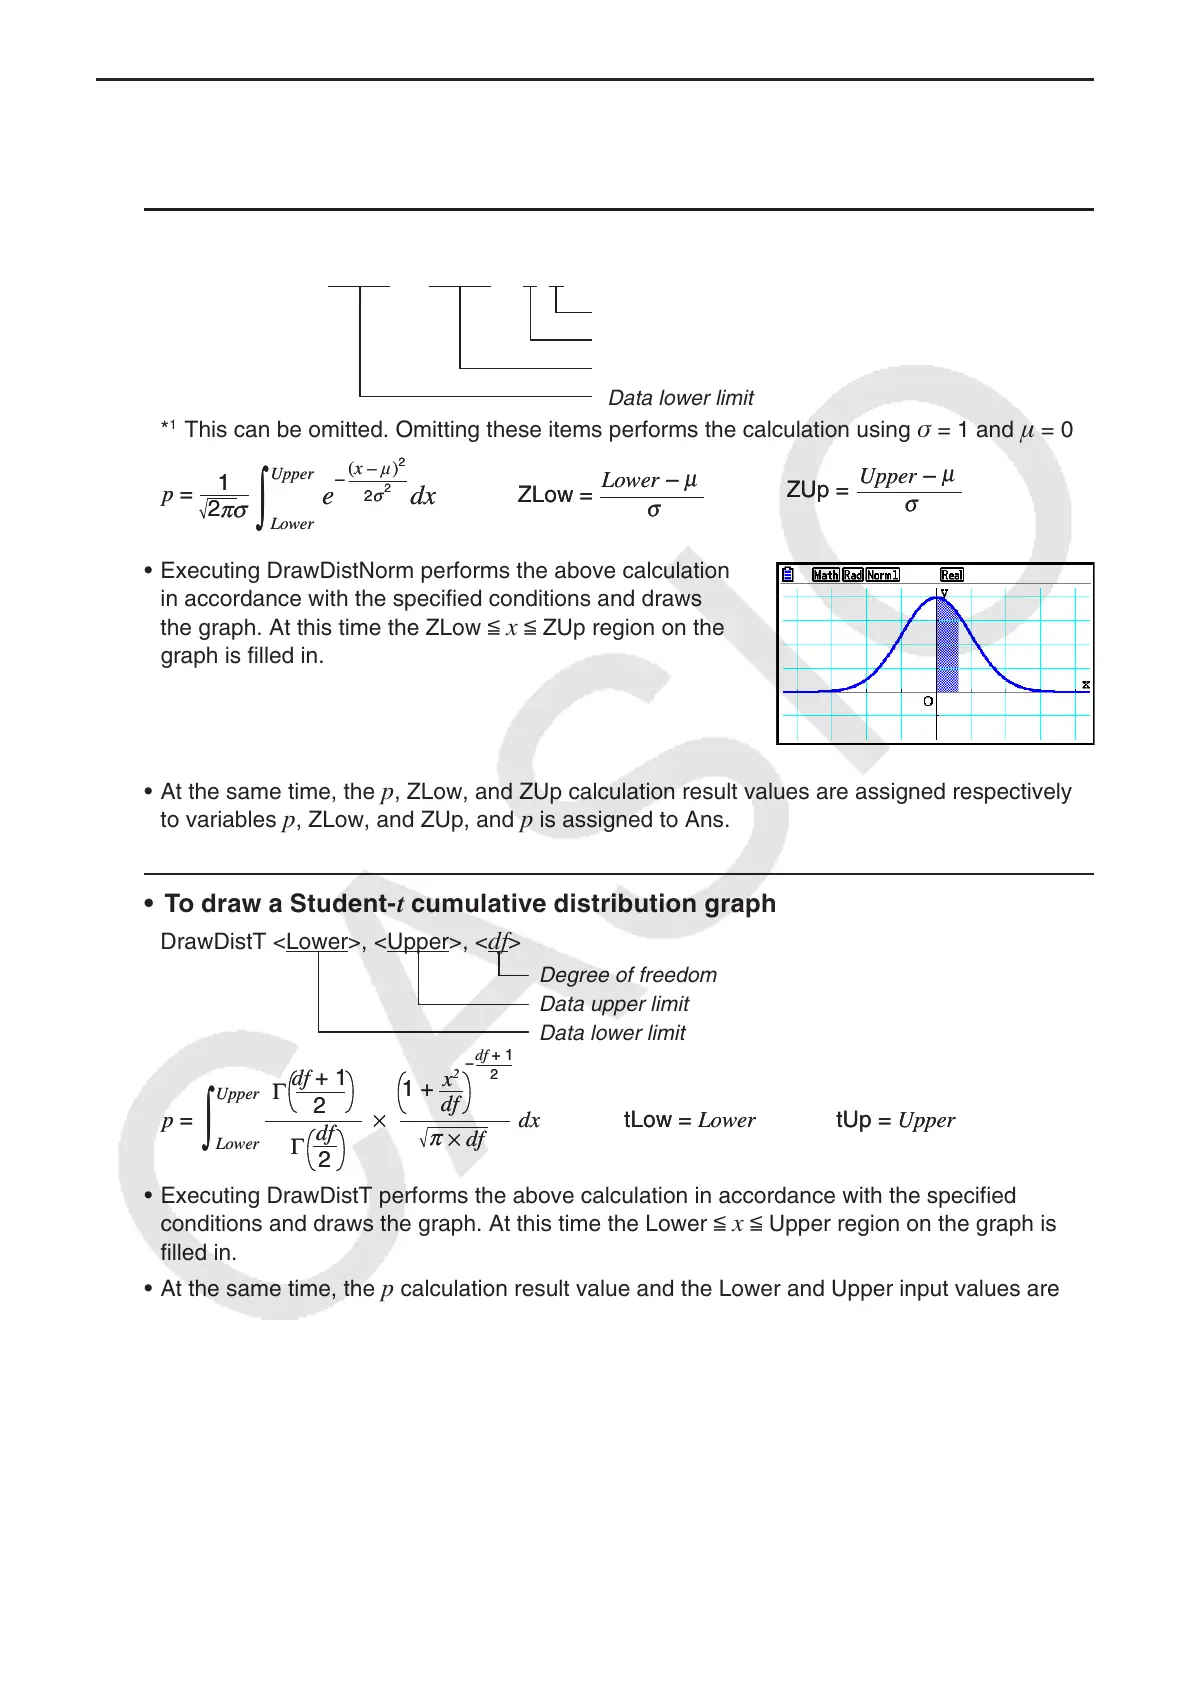
• Executing DrawDistNorm performs the above calculation
in accordance with the specified conditions and draws
the graph. At this time the ZLow <
x < ZUp region on the
graph is filled in.
• At the same time, the
p, ZLow, and ZUp calculation result values are assigned respectively
to variables p, ZLow, and ZUp, and p is assigned to Ans.
• To draw a Student- t cumulative distribution graph
DrawDistT <Lower>, <Upper>, <df>
Degree of freedom
Data upper limit
Data lower limit
• Executing DrawDistT performs the above calculation in accordance with the specified
conditions and draws the graph. At this time the Lower <
x < Upper region on the graph is
filled in.
• At the same time, the
p calculation result value and the Lower and Upper input values are
assigned respectively to variables
p , tLow, and tUp, and p is assigned to Ans.
πσ
2
p =
dx
1
e
–
2
2
σ
(x – μ)
2
μ
Upper
Lower
∫
ZUp =
σ
Upper –
μ
ZLow =
σ
Lower –
μ
πσ
2
p =
dx
1
e
–
2
2
σ
(x – μ)
2
μ
Upper
Lower
∫
ZUp =
σ
Upper –
μ
ZLow =
σ
Lower –
μ
tLow = Lower tUp = Upper
Γ
2
df + 1
df
x
2
1 +
df + 1
2
p = ×
–
Γ
2
df
dx
df
×
π
Upper
Lower
∫
tLow = Lower tUp = Upper
Γ
2
df + 1
df
x
2
1 +
df + 1
2
p = ×
–
Γ
2
df
dx
df
×
π
Upper
Lower
∫

 Loading...


