5-28
Example Register {3, 1, −1} in List 1, and then graph y = (List 1)x
2
− 3.
Use the following V-Window settings.
Xmin = –5, Xmax = 5, Xscale = 1
Ymin = –10, Ymax = 10, Yscale = 2
1 m Statistics
dwbw-bw
2 m Graph
3 !m(SET UP)cccc3(Off)J
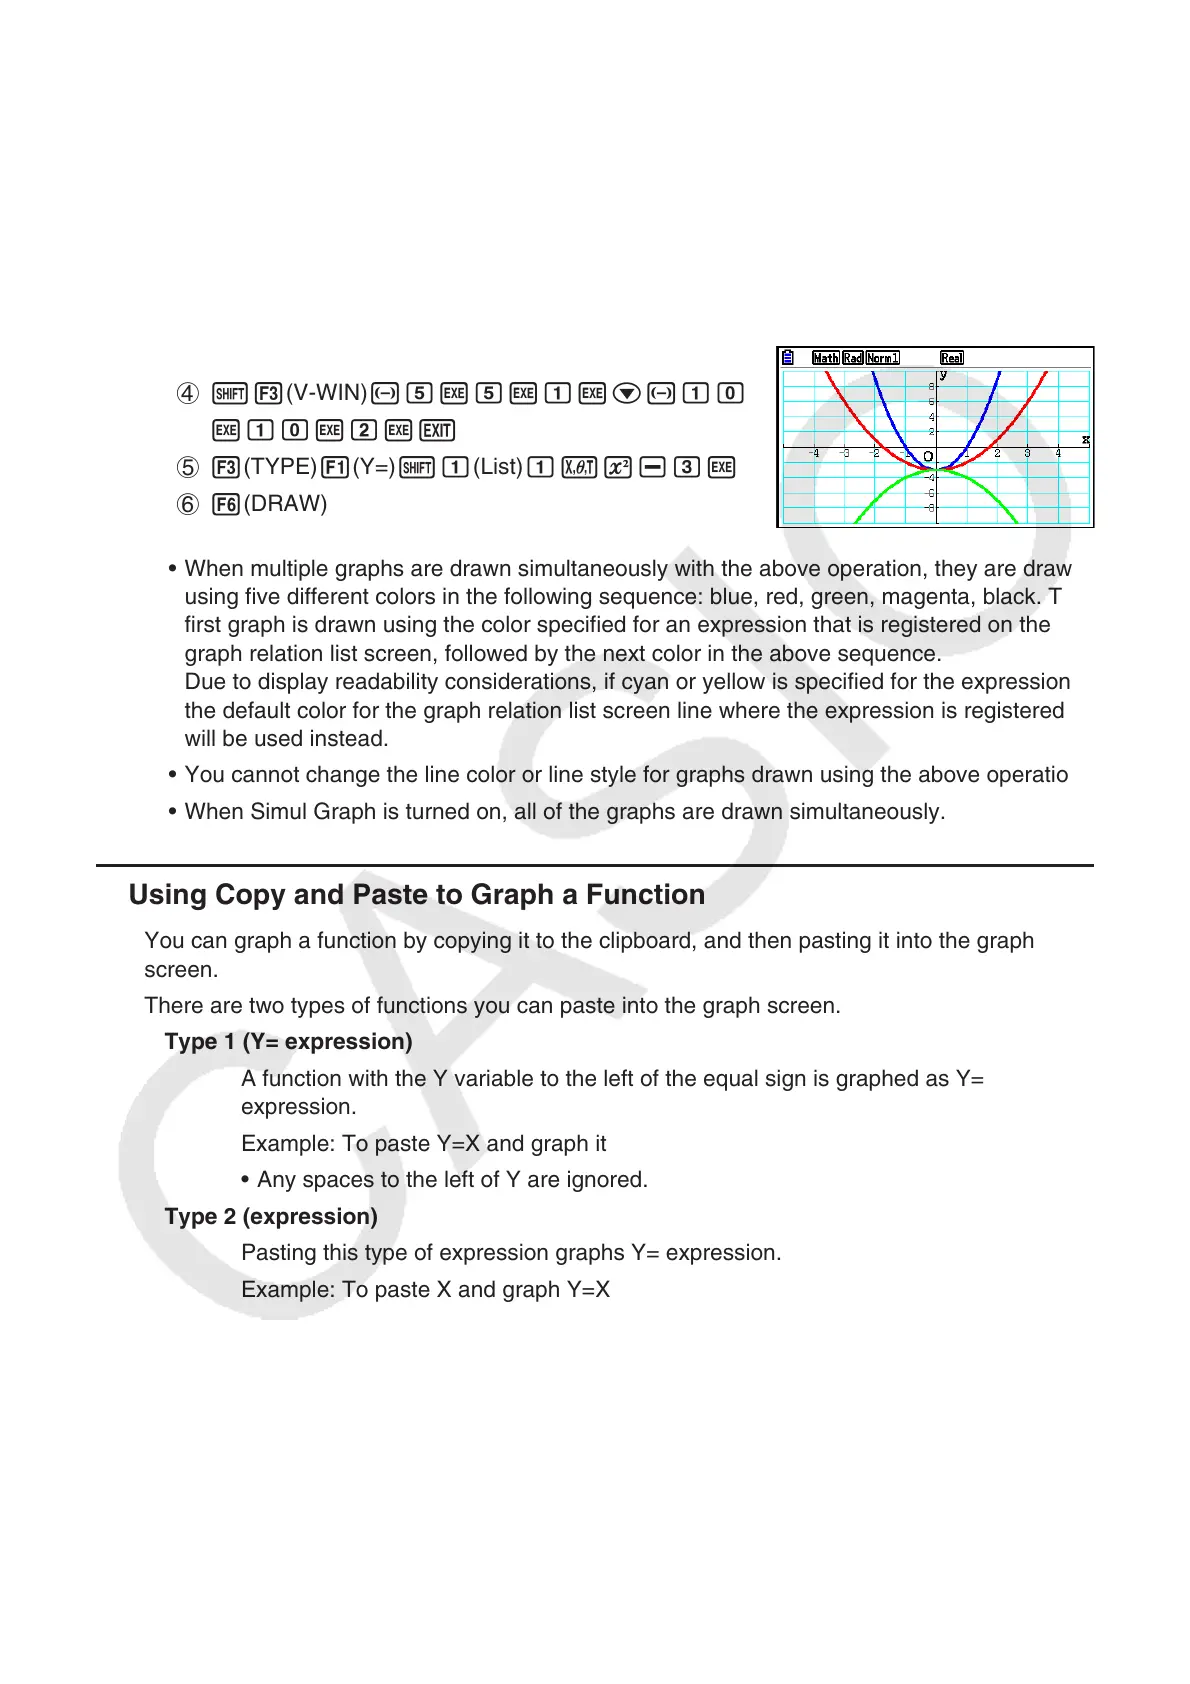
4 !3(V-WIN)-fwfwbwc-ba
wbawcwJ
5 3(TYPE)1(Y=)!b(List)bvx-dw
6 6(DRAW)
• When multiple graphs are drawn simultaneously with the above operation, they are drawn
using five different colors in the following sequence: blue, red, green, magenta, black. The
first graph is drawn using the color specified for an expression that is registered on the
graph relation list screen, followed by the next color in the above sequence.
Due to display readability considerations, if cyan or yellow is specified for the expression,
the default color for the graph relation list screen line where the expression is registered
will be used instead.
• You cannot change the line color or line style for graphs drawn using the above operation.
• When Simul Graph is turned on, all of the graphs are drawn simultaneously.
k Using Copy and Paste to Graph a Function
You can graph a function by copying it to the clipboard, and then pasting it into the graph
screen.
There are two types of functions you can paste into the graph screen.
Type 1 (Y= expression)
A function with the Y variable to the left of the equal sign is graphed as Y=
expression.
Example: To paste Y=X and graph it
• Any spaces to the left of Y are ignored.
Type 2 (expression)
Pasting this type of expression graphs Y= expression.
Example: To paste X and graph Y=X
• Any spaces to the left of the expression are ignored.

 Loading...


