5-52
13. Function Analysis
k Reading Coordinates on a Graph Line
Trace lets you move a pointer along a graph and read out coordinates on the display.
1. From the Main Menu, enter the Graph mode.
2. Draw the graph.
3. Press !1(TRACE), and a pointer appears in the center of the graph.*
1
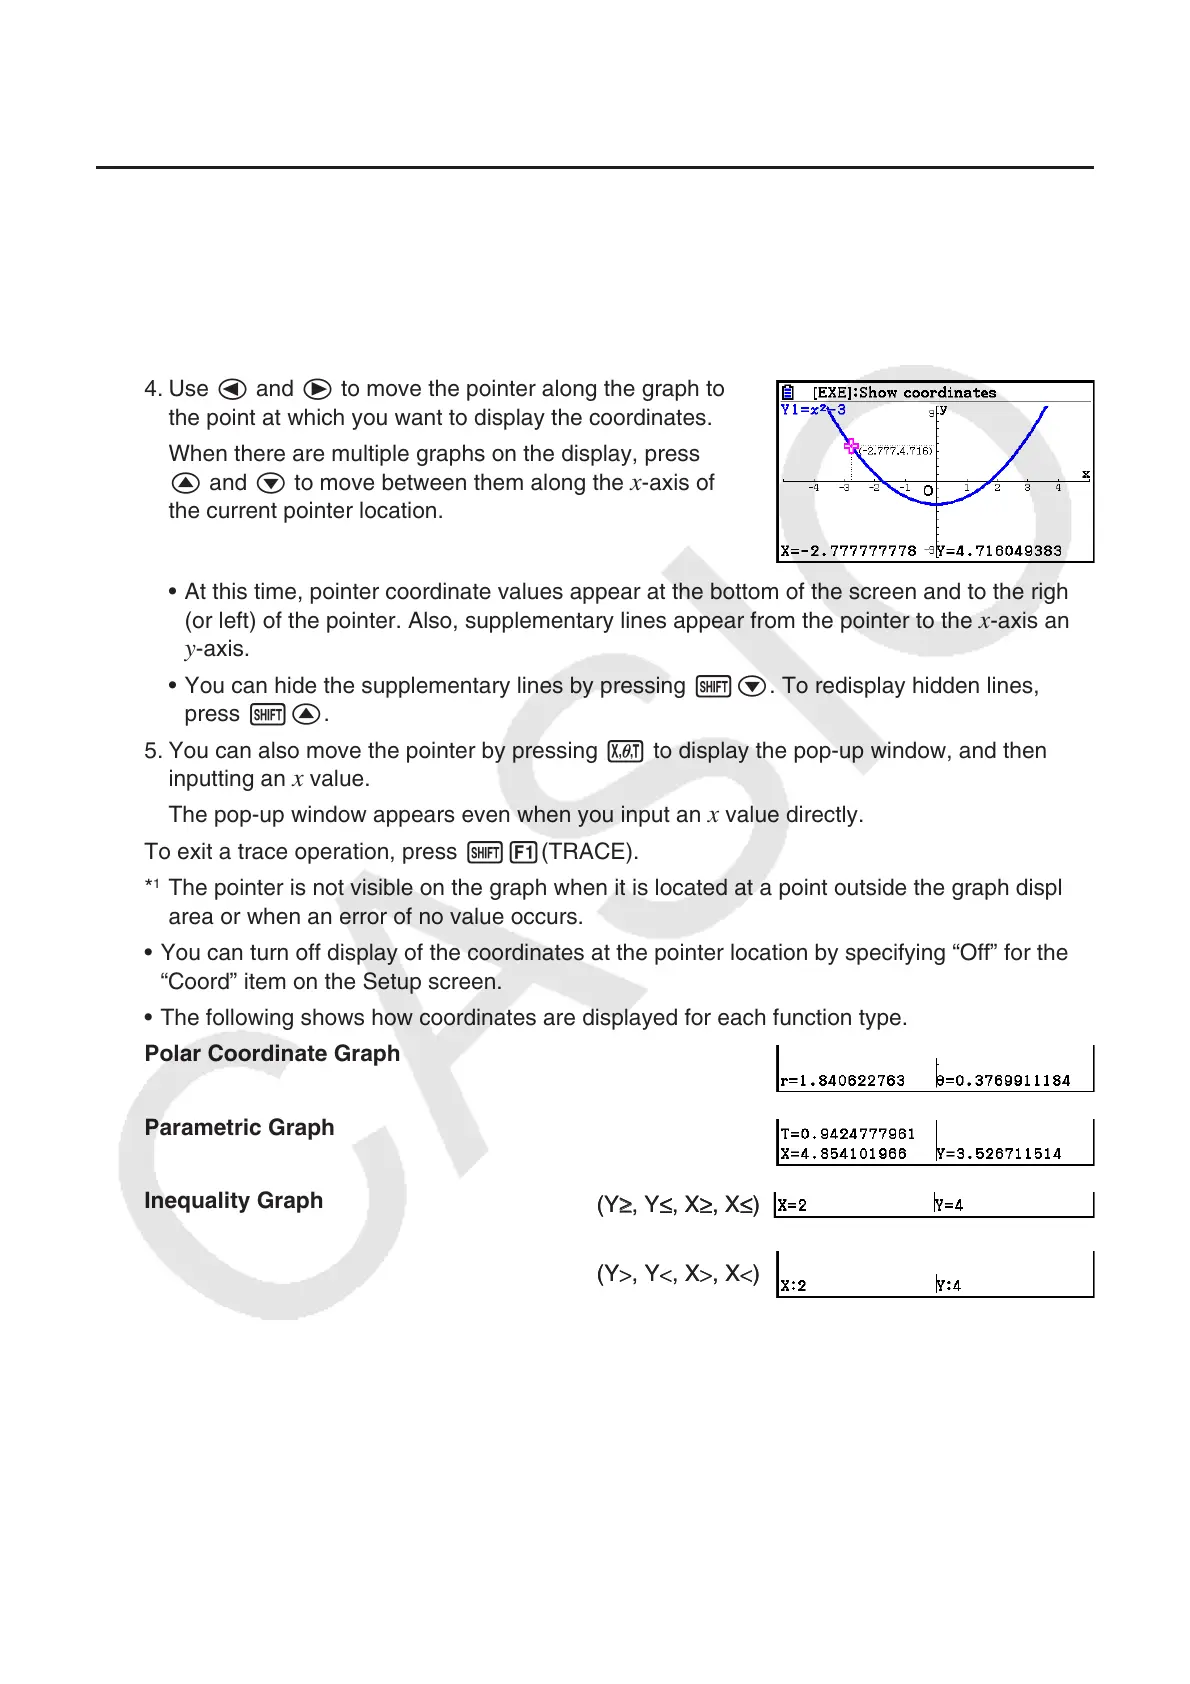
4. Use d and e to move the pointer along the graph to
the point at which you want to display the coordinates.
When there are multiple graphs on the display, press
f and c to move between them along the
x-axis of
the current pointer location.
• At this time, pointer coordinate values appear at the bottom of the screen and to the right
(or left) of the pointer. Also, supplementary lines appear from the pointer to the
x-axis and
y-axis.
• You can hide the supplementary lines by pressing !c. To redisplay hidden lines,
press !f.
5. You can also move the pointer by pressing v to display the pop-up window, and then
inputting an
x value.
The pop-up window appears even when you input an
x value directly.
To exit a trace operation, press !1(TRACE).
*
1
The pointer is not visible on the graph when it is located at a point outside the graph display
area or when an error of no value occurs.
• You can turn off display of the coordinates at the pointer location by specifying “Off” for the
“Coord” item on the Setup screen.
• The following shows how coordinates are displayed for each function type.
Polar Coordinate Graph
Parametric Graph
Inequality Graph
(Y
≥
, Y
, X
, X
)(Y
≥
, Y
, X
, X
)
(Y
>
, Y
<
, X
>
, X
<
)(Y
>
, Y
<
, X
>
, X
<
)

 Loading...


