5-59
u To determine the integration value and area between the roots of a graph
and the point of intersection of two graphs
1. Draw the graphs.
2. Press !5(G-SOLVE)6(g)3(∫d
x)e(MIXED).
• If there are three or more graphs on the graph screen, one of them will be flashing.
Use f and c to move the flashing to the graph whose integrated value you want to
determine and then press w. Move the flashing again to one of the other graphs and
then press w.
3. Use d and e to move the pointer to the lowermost side of the integration region, and
then press w.
4. Use d and e to move the pointer to the uppermost side of the integration region, and
then press w.
5. Press w to calculate the integrated value and the area value.
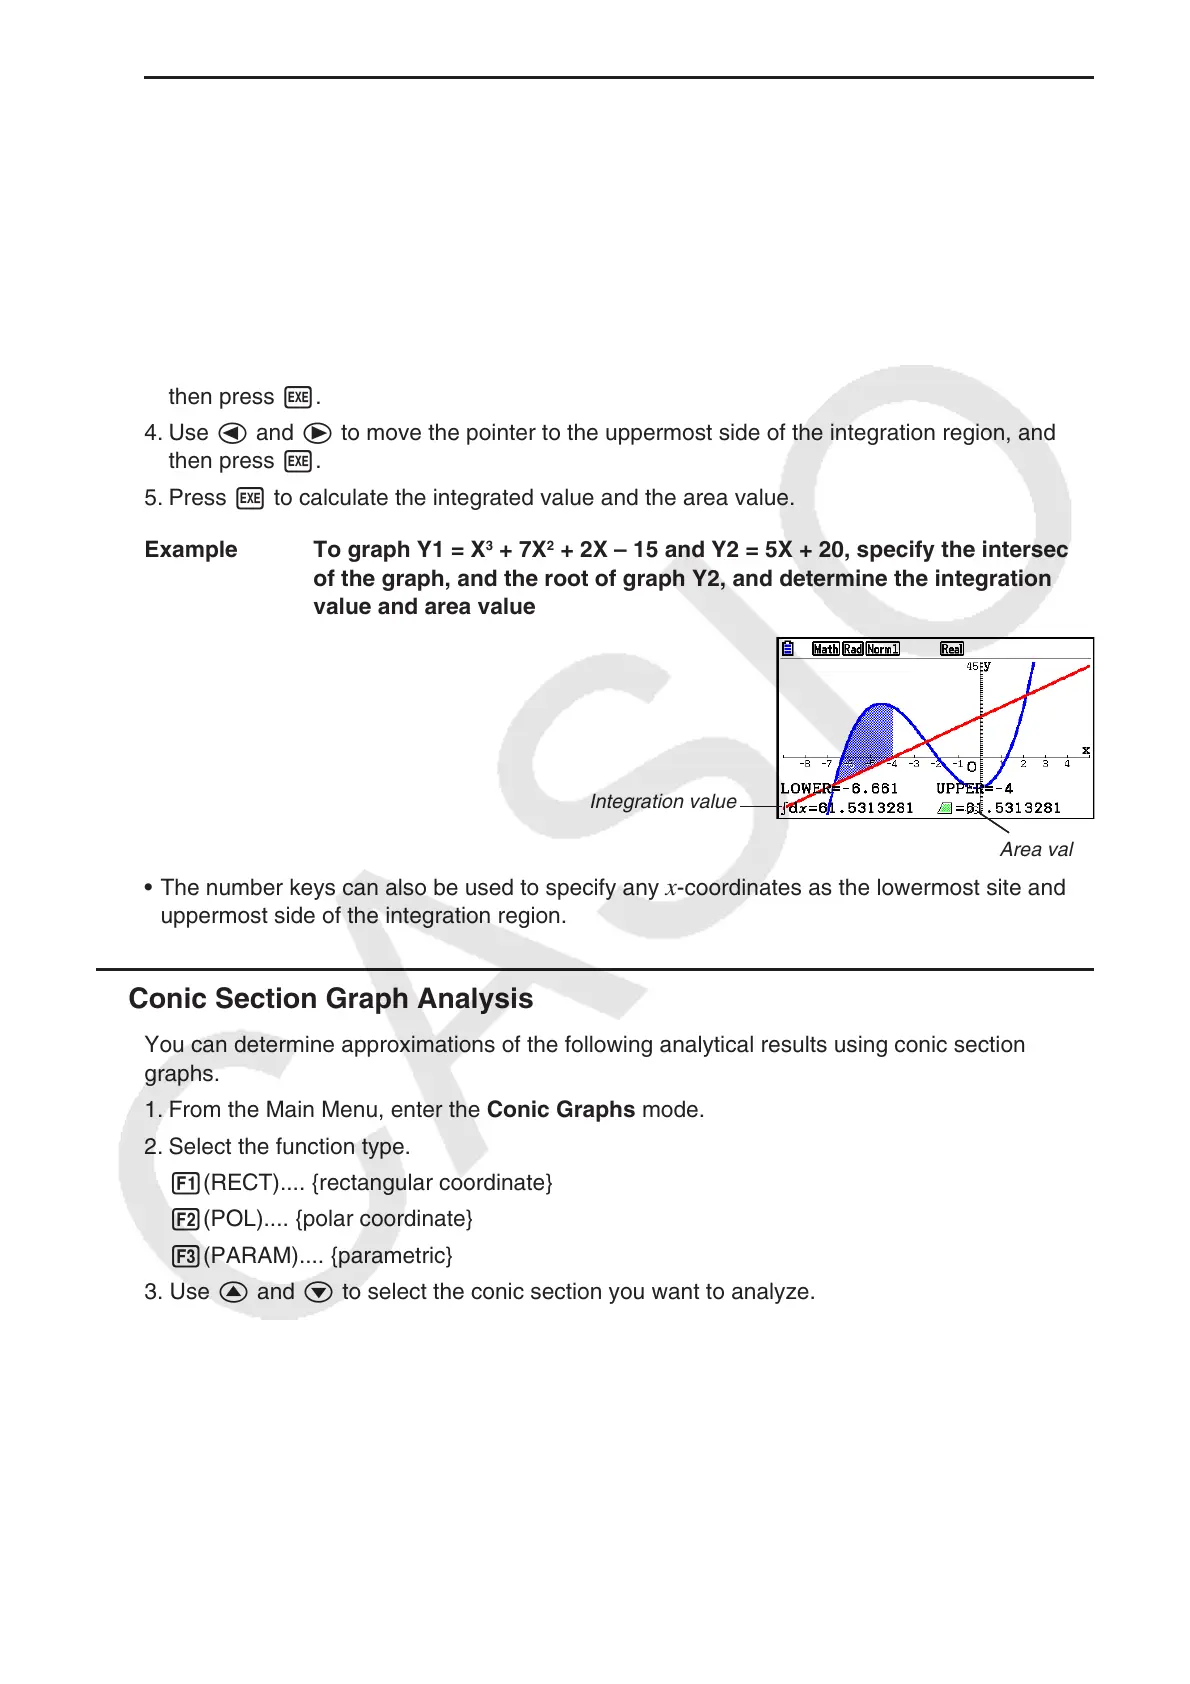
Example To graph Y1 = X
3
+ 7X
2
+ 2X – 15 and Y2 = 5X + 20, specify the intersect
of the graph, and the root of graph Y2, and determine the integration
value and area value
Integration value
Area value
• The number keys can also be used to specify any x-coordinates as the lowermost site and
uppermost side of the integration region.
k Conic Section Graph Analysis
You can determine approximations of the following analytical results using conic section
graphs.
1. From the Main Menu, enter the Conic Graphs mode.
2. Select the function type.
1(RECT).... {rectangular coordinate}
2(POL).... {polar coordinate}
3(PARAM).... {parametric}
3. Use f and c to select the conic section you want to analyze.
4. Input the conic section constants.
5. Draw the graph.

 Loading...


