5-48
Example To draw the WEB graph for the recursion formula a
n
+1
= –3( a
n
)
2
+ 3 a
n
, b
n
+1
= 3 b
n
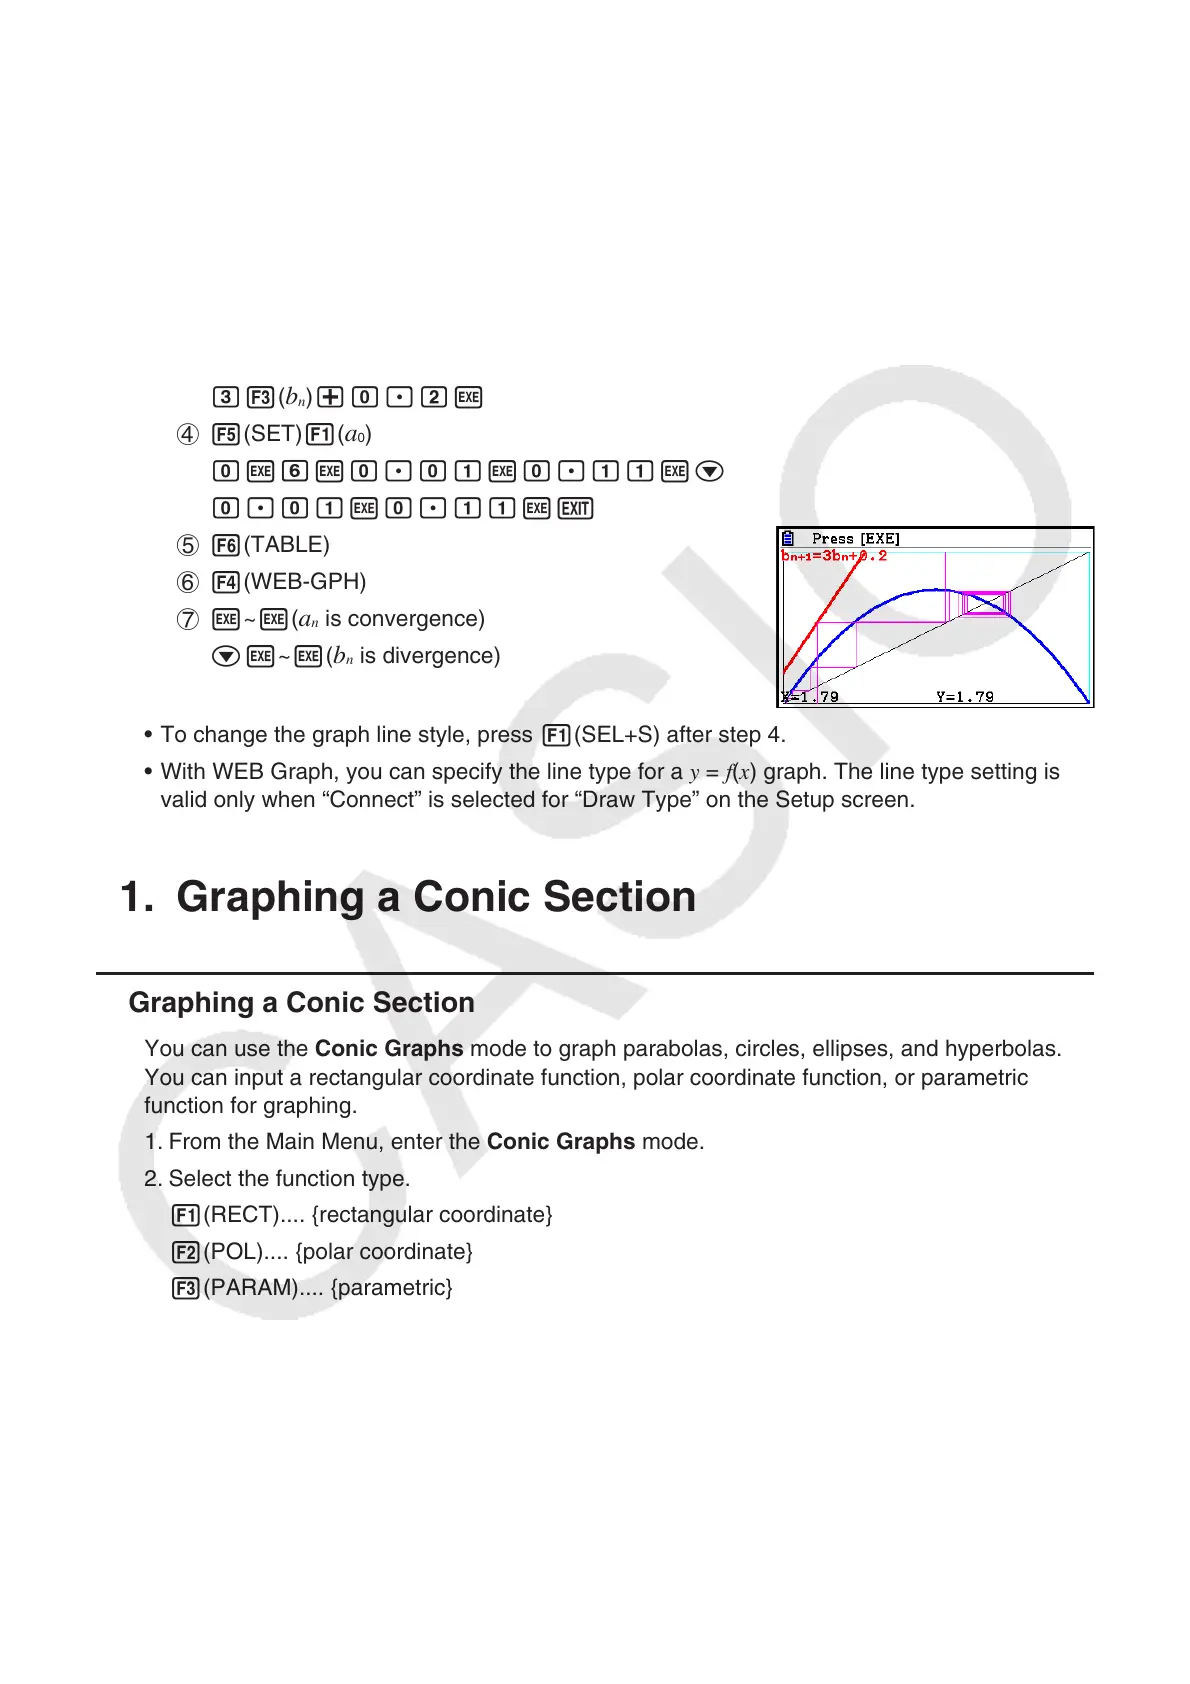
+ 0.2, and check for divergence or convergence. Use the following
table range: Start = 0, End = 6,
a
0
= 0.01, a
n
Str = 0.01, b
0
= 0.11, b
n
Str
= 0.11
1 m Recursion
2 !3(V-WIN) awbwbwc
awbwbwJ
3 3(TYPE) 2(
a
n
+1
) -d2( a
n
) x+d2( a
n
) w
d3(
b
n
) +a.cw
4 5(SET) 1(
a
0
)
awgwa.abwa.bbwc
a.abwa.bbwJ
5 6(TABLE)
6 4(WEB-GPH)
7 w~ w(
a
n
is convergence)
cw~w(
b
n
is divergence)
• To change the graph line style, press 1(SEL+S) after step 4.
• With WEB Graph, you can specify the line type for a y = f ( x ) graph. The line type setting is
valid only when “Connect” is selected for “Draw Type” on the Setup screen.
11. Graphing a Conic Section
k Graphing a Conic Section
You can use the Conic Graphs mode to graph parabolas, circles, ellipses, and hyperbolas.
You can input a rectangular coordinate function, polar coordinate function, or parametric
function for graphing.
1. From the Main Menu, enter the Conic Graphs mode.
2. Select the function type.
1(RECT).... {rectangular coordinate}
2(POL).... {polar coordinate}
3(PARAM).... {parametric}

 Loading...


