ε-38
Using the Graph Analysis Tools to Graph Data
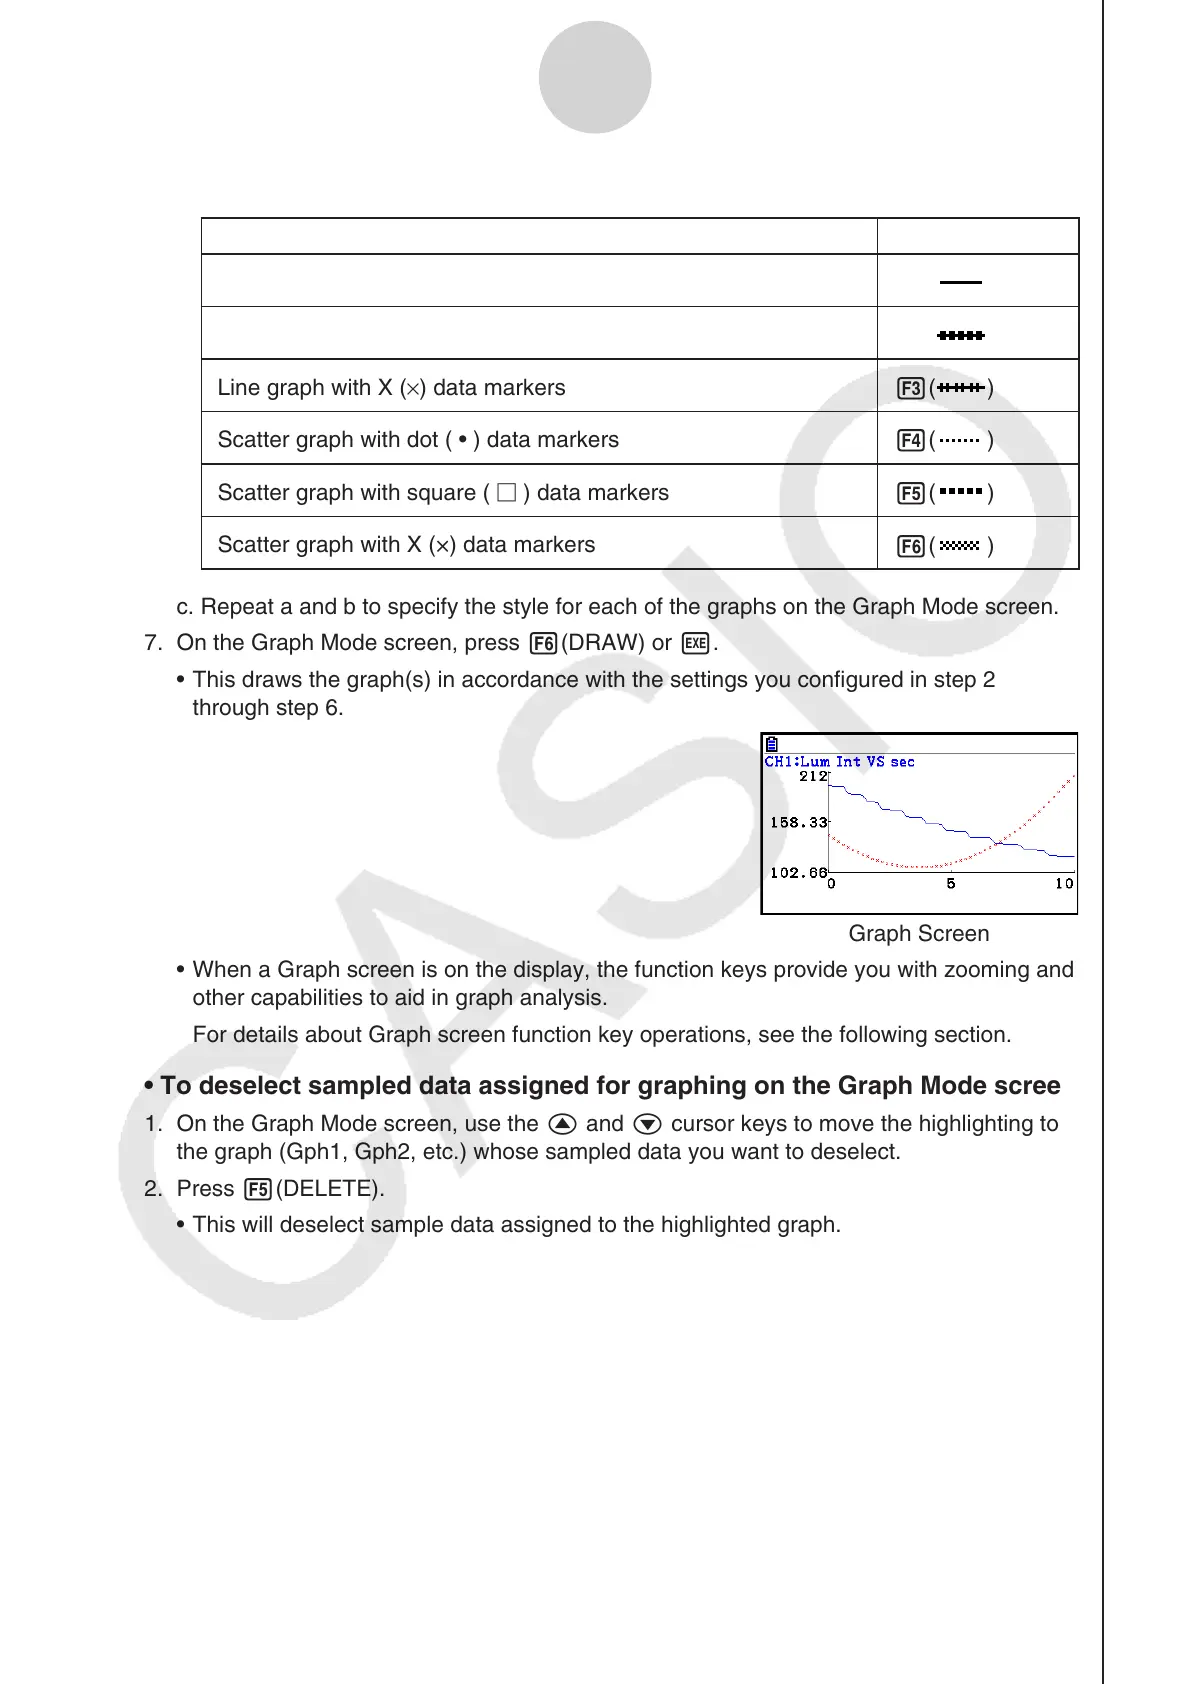
b. Use the function keys to specify the graph style you want.
To specify this graph style: Press this key:
Line graph with dot ( • ) data markers
1(
)
Line graph with square ( ) data markers
2(
)
Line graph with X (×) data markers
3(
)
Scatter graph with dot ( • ) data markers
4(
)
Scatter graph with square ( ) data markers
5(
)
Scatter graph with X (×) data markers
6(
)
c. Repeat a and b to specify the style for each of the graphs on the Graph Mode screen.
7. On the Graph Mode screen, press 6(DRAW) or w.
• This draws the graph(s) in accordance with the settings you configured in step 2
through step 6.
Graph Screen
• When a Graph screen is on the display, the function keys provide you with zooming and
other capabilities to aid in graph analysis.
For details about Graph screen function key operations, see the following section.
• To deselect sampled data assigned for graphing on the Graph Mode screen
1. On the Graph Mode screen, use the f and c cursor keys to move the highlighting to
the graph (Gph1, Gph2, etc.) whose sampled data you want to deselect.
2. Press 5(DELETE).
• This will deselect sample data assigned to the highlighted graph.

 Loading...


