Working with Test Results
4-82 72A-1898 Rev. A 11/01
Monday, November 26, 2001 1:09 pm
Signal Viewer
The Graphics tab of the TDR9000 works as part of another Doble
Engineering program called Signal Viewer. For the most part, this
program remains indistinguishable to the user as it relates to TDR9000
operation. As graphical results are used and manipulated, however, the
Signal Viewer program is in use and the display properties of this
program are accessible for configuration.
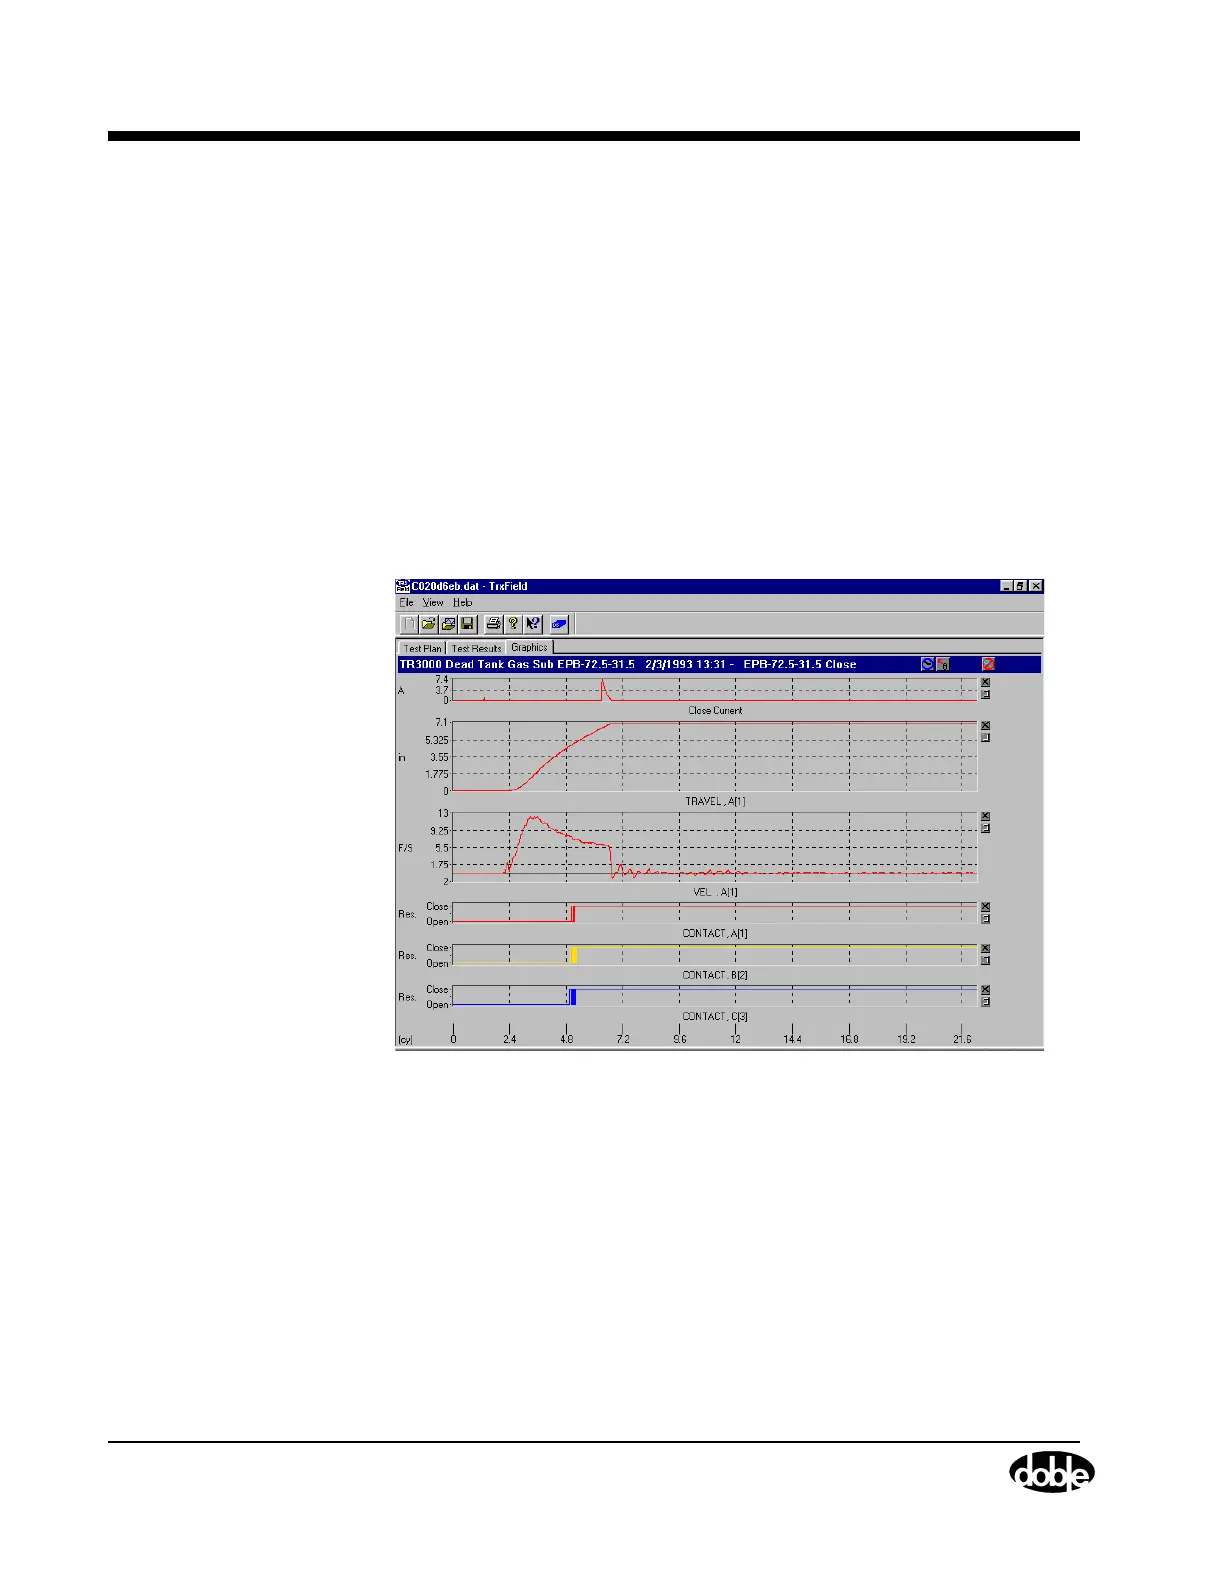
When viewing test results, they appear in graphical form (Figure 4.58)
on the Graphics tab or in tabulated form on the Tabulation tab. The
graphics can be zoomed, overlaid, and re-ordered. Cursors are used to
mark key points of a channel and determine their value and time of
occurrence. The Time and Channel values only appear when a cursor is
active.
Figure 4.58 Graphical Display of Test Results
 Loading...