Working with Test Results
4-84 72A-1898 Rev. A 11/01
Monday, November 26, 2001 1:09 pm
Displaying Time
and Channel
Values on the
Graphs Tab
Time and channel values appear only when a cursor is active, as
described in ”Cursors” on page 4-90. When a cursor is active, time
appears in the lower left corner. The channel values appears to the right
of each channel.
• Red channel values represent the point marked by the red cursor.
• Green channel values represent the point marked by the green
cursor.
To display time and channel values:
1. Move the cursor to determine the value of the channel at different
points in time. If both cursors are active, the difference between the
two is also displayed in yellow.
When channels are overlaid, only time values appear.
2. Right-click a set of overlaid curves to obtain its values.
The menu shown in Figure 4.60 appears.
Figure 4.60 Properties Window
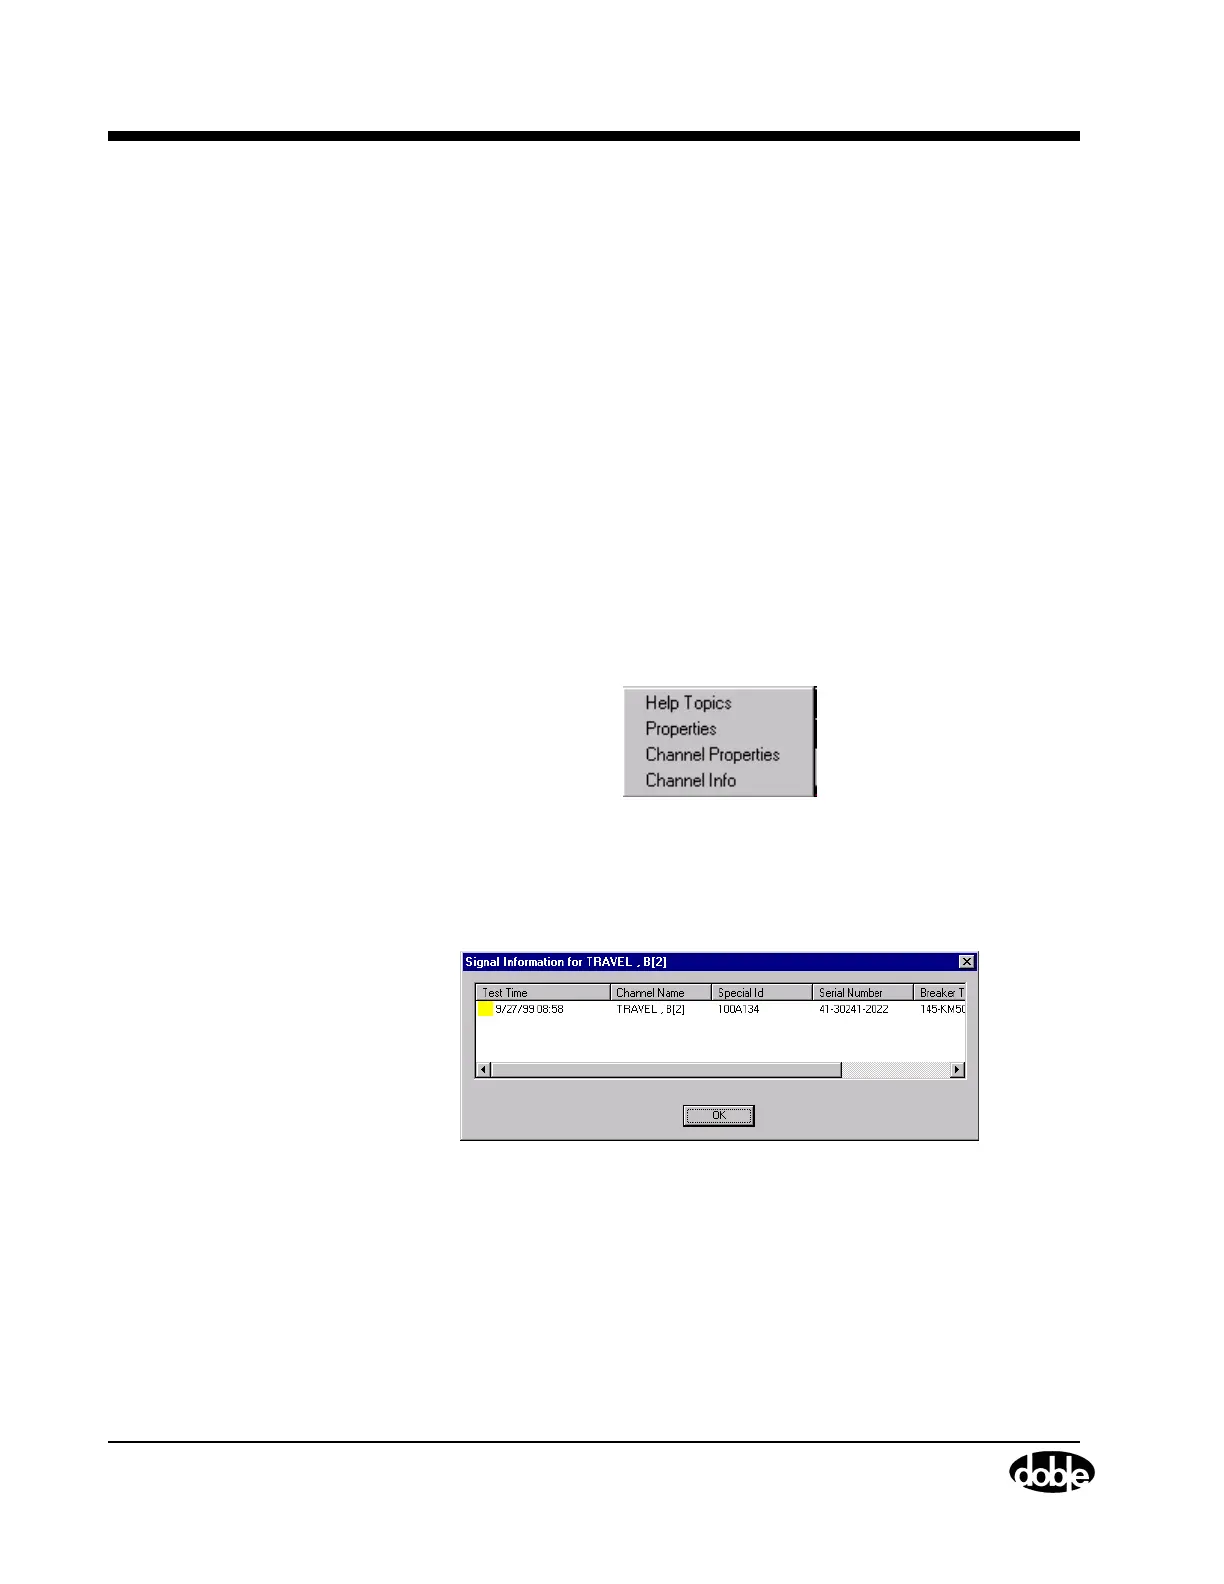
3. Select Channel Info.
The Signal Information window shown in Figure 4.61 appears.
Figure 4.61 Signal Information Window
4. Note the information needed to select the Test Result desired for
further viewing.
5. Open a Test Result using the Open icon or the File/Open command.
View it alone to see values for each channel when cursors are
activated.
 Loading...