24.7 Curves
■■■■■■■■■■■■■■■■■■■■■■
228
■■■■■■■■
900 Touch Control
[Endpoint details]
Display details for each endpoint found (see "Endpoint details", page
217).
[Measuring point list]
Display measuring point list of titrations and measurements (see "Measur-
ing point list", page 217).
[Curve options]
Define the settings for the curve display (see "Curve options", page 228).
The settings are saved separately for each titration/measuring mode and
apply not only for the live display but also for the curve display in the
results dialog.
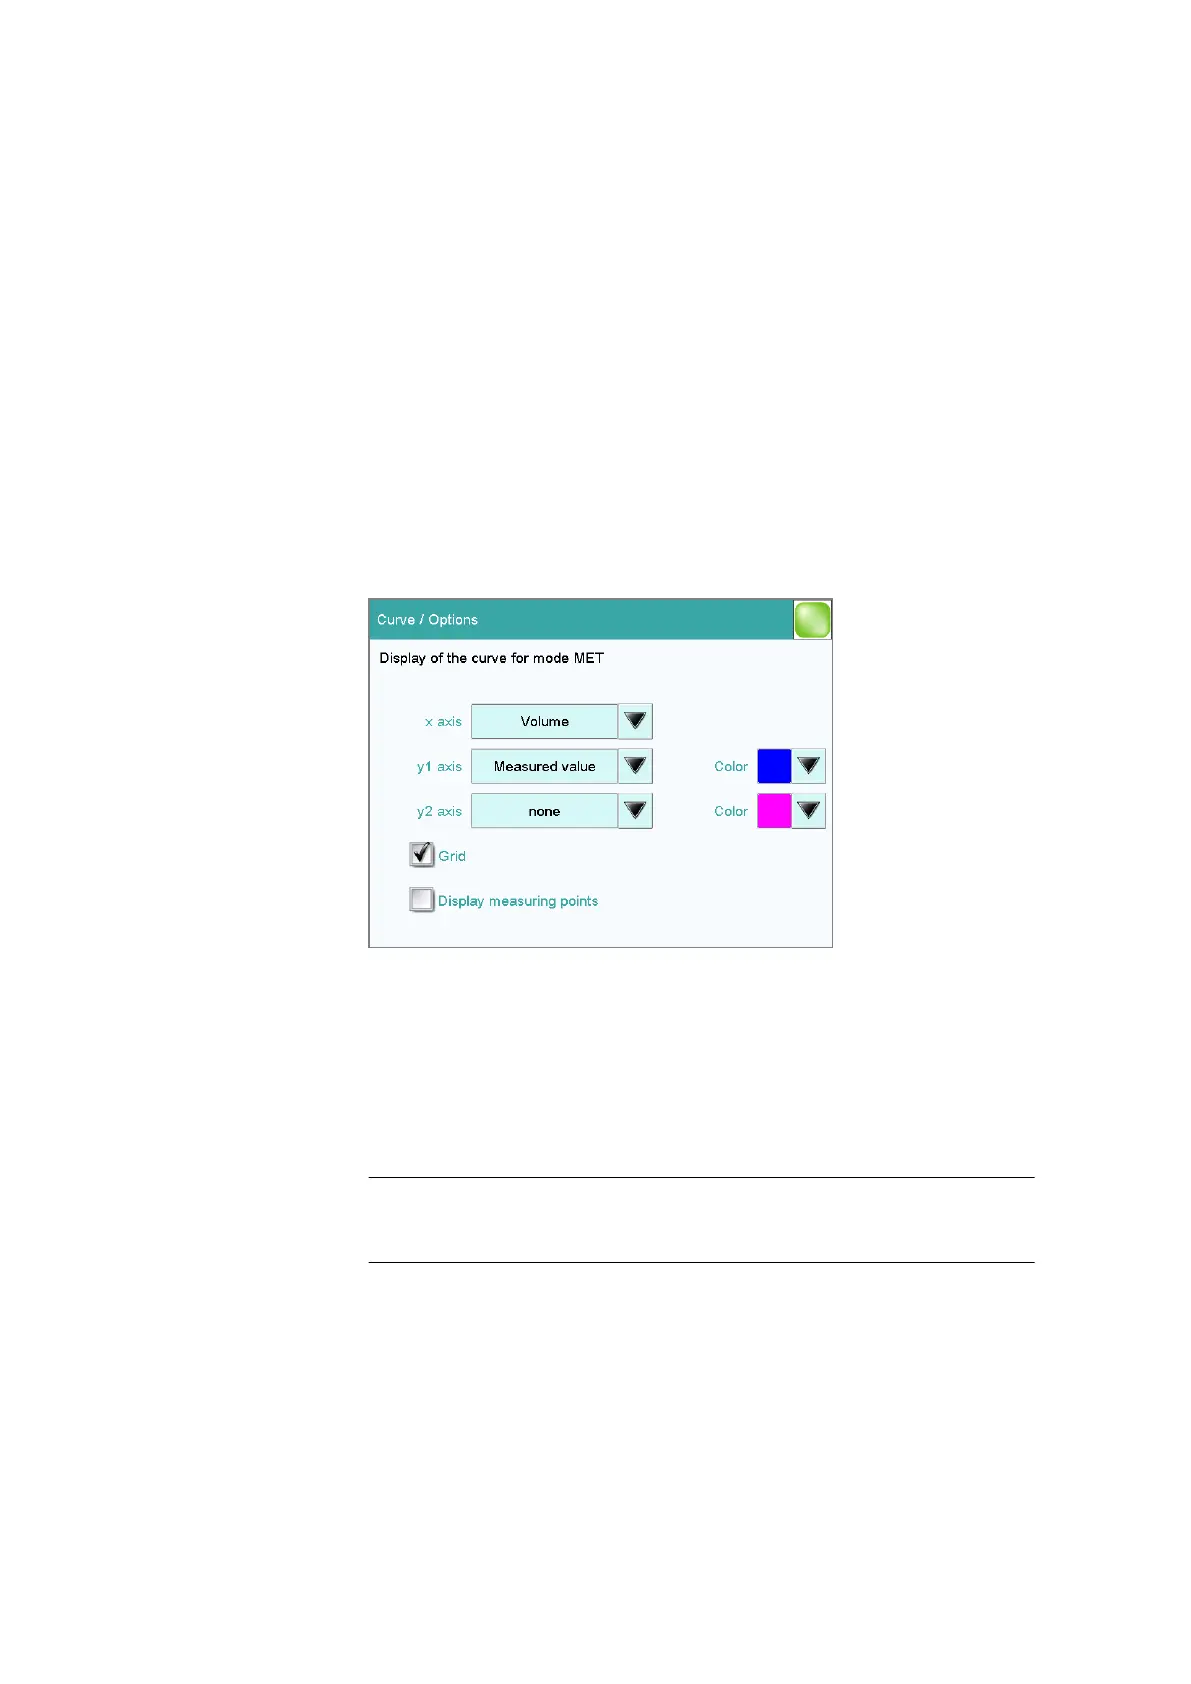
Curve options
Results dialog: Curve ▶ Curve options
You can make the settings for the curve display in the Curve / Options
dialog. These settings are saved separately for each mode (DET, MET, etc.)
and also apply for the live display. Both the selection of the quantities and
the default setting depend on the mode.
x axis
Quantity which is shown on the x axis of the graph.
Selection Volume | Measured value | ERC | Delta
meas.value | Time | Temperature | Volume
drift | Signal drift
y1 axis
Quantity which is shown on the y1 axis of the graph.