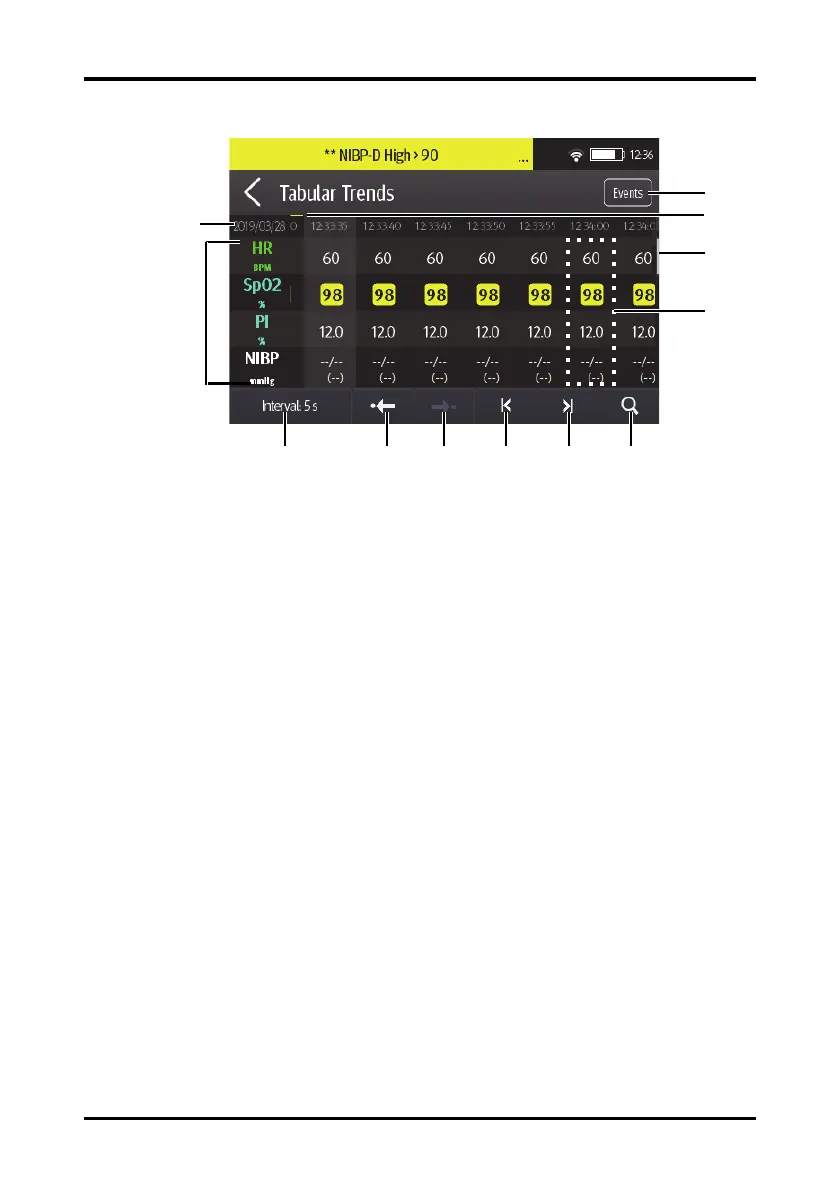
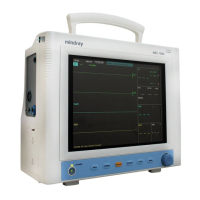
Review Tabular Trends Review Page
TM80 Telemetry Monitor Operator's Manual 11 - 3
1. Current system date and trend data time. The interval of the trend data time is
dependent on the option selected for Interval.
2. Digital area: displays numeric values at the cursor indicated time. The background
color of numeric values indicates the alarm priority.
◆ Red: high priority alarm event
◆ Yellow: medium priority alarm event
◆ Cyan: low priority alarm event
3. Events button: tapping this button goes to the events review page.
4. Event type indicator: different color blocks indicate different types of events:
◆ Red: high priority alarm event
◆ Yellow: medium priority alarm event
◆ Cyan: low priority alarm event
◆ Green: manual event
◆ White: operation-related event such as system time change
5. Vertical bar: indicates the position of currently displayed parameters in all the
parameters.
6. Highlighted column: indicates the trend data currently selected.
7. Search button: allows searching trend data within the specific time range.
8. Next page button: tapping this button moves to the right-most column of the
review page.
9. Previous page button: tapping this button moves to the left-most column of the
review page.