Monitoring with the TM80 at the CMS ST Monitoring
TM80 Telemetry Monitor Operator’s Manual 13 - 7
13.5.2.2 Configuring the QT View
To configure the QT view, follow this procedure:
1. Enter QT View.
2. Select the buttons described in the following table as desired.
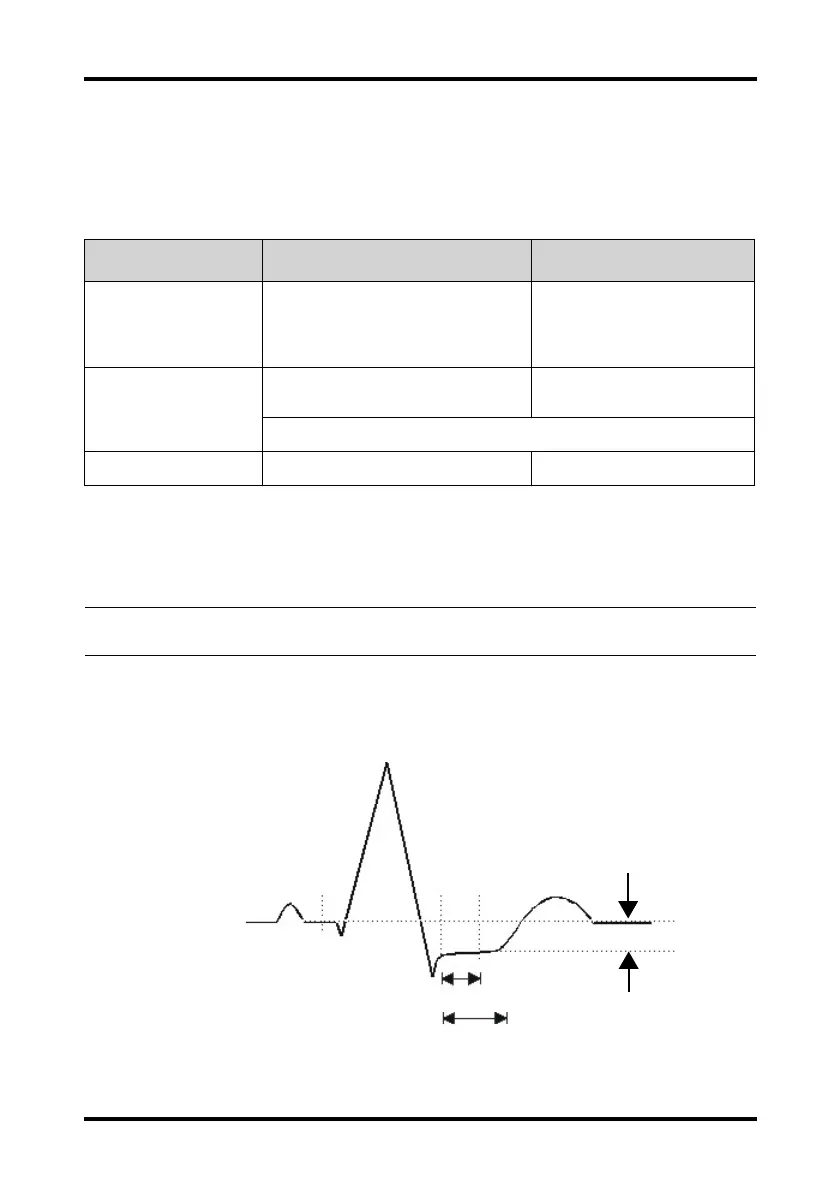
13.6 ST Monitoring
A normal ECG waveform (for ST monitoring)
Buttons Description Settings*
Left or right arrow Select the desired lead to display on the
QT View
menu screen by selecting the left
or right arrow.
II, I, III, aVR, aVL, aVF, V
Note: the leads here serve as an
example only. They depend on
the Lead Set selected.
Set Baseline Set an ST baseline when ST values become
stable.
None
The ST template updated time displays at the bottom of the screen.
Hide Baseline Hides the reference baseline. None
* The factory default settings are in bold.
NOTE
• The display of the QT digital area differs as related settings change.
R
P
T
S
ST Point
J Point
ISO Point
40 to 80 msec
ST deviation
Depression or Elevation
ST Segment