R&S
®
ZVA / R&S
®
ZVB / R&S
®
ZVT GUI Reference
Trace Menu
Operating Manual 1145.1084.12 – 30 144
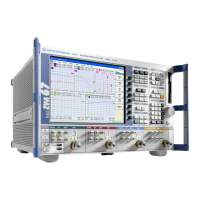
comparable to the delay itself. Then the delay curve is noisy as shown below. The aperture in the
example is set to 400 MHz / 200 = 2 MHz, the group delay uncertainty is approx. 0.5 ns. The
estimated uncertainty of the phase difference measurement is δ(ΔΦ) < 0.4 deg, in accordance
with the specified phase uncertainty of the network analyzer.
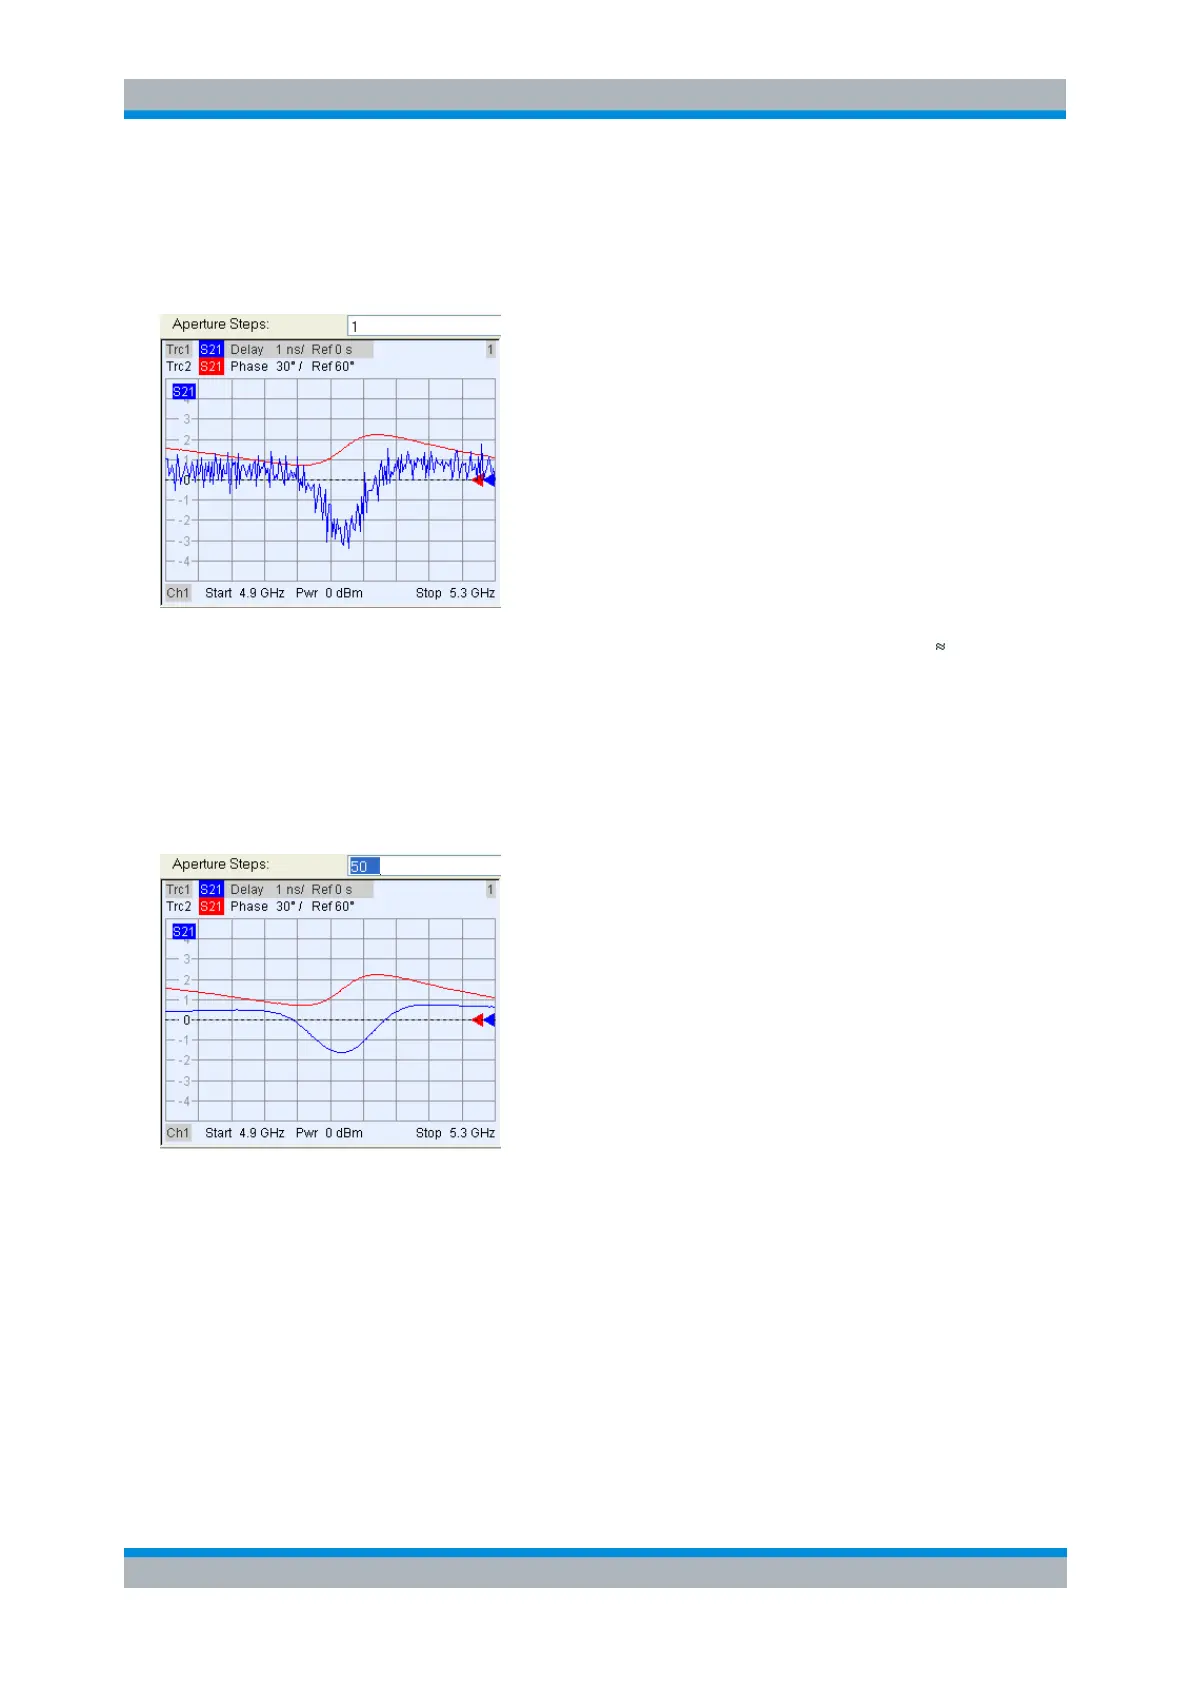
With a phase uncertainty δ(ΔΦ) < 0.4 deg, the uncertainty of the delay equals to δτ 0.001/Δf.
For vector network analyzers R&S ZVA8 and default settings (maximum span, 201 sweep points),
the aperture is approx. 8 GHz * 10 / 200 = 400 MHz. The delay uncertainty is smaller than 2.5 ps.
In many instances an aperture around Δf = 0.3 / τ
g,meas
provides optimum measurement accuracy.
For a measured group delay of 1 ns (corresponding to a cable with an electrical length of approx.
30 cm), this condition results in an aperture of 300 MHz. Optimum apertures for other group delay
values are listed below. In the following example, the measured group delay is approx. 3 ns. A
100 MHz aperture virtually eliminates the noise on the trace.
The 100 MHz aperture in the example above is actually too wide, because the phase shows
strong distortions in a frequency interval with a width of approx. 80 MHz. The wide aperture
results in a smoothing effect of the delay trace. A reduced aperture of 20 MHz yields a more
accurate group delay in the vicinity of the minimum.