R&S
®
ZVA / R&S
®
ZVB / R&S
®
ZVT GUI Reference
Channel Menu
Operating Manual 1145.1084.12 – 30 268
Receiver and source ports scan be selected although they may not be currently used. The analyzer can
store predefined receiver settings for arbitrary port configurations.
Shift Stimulus defines an offset time for the current receiver and source port. This is important for
measuring DUTs with a noticeable transmission delay.
Effect of shift stimulus and examples
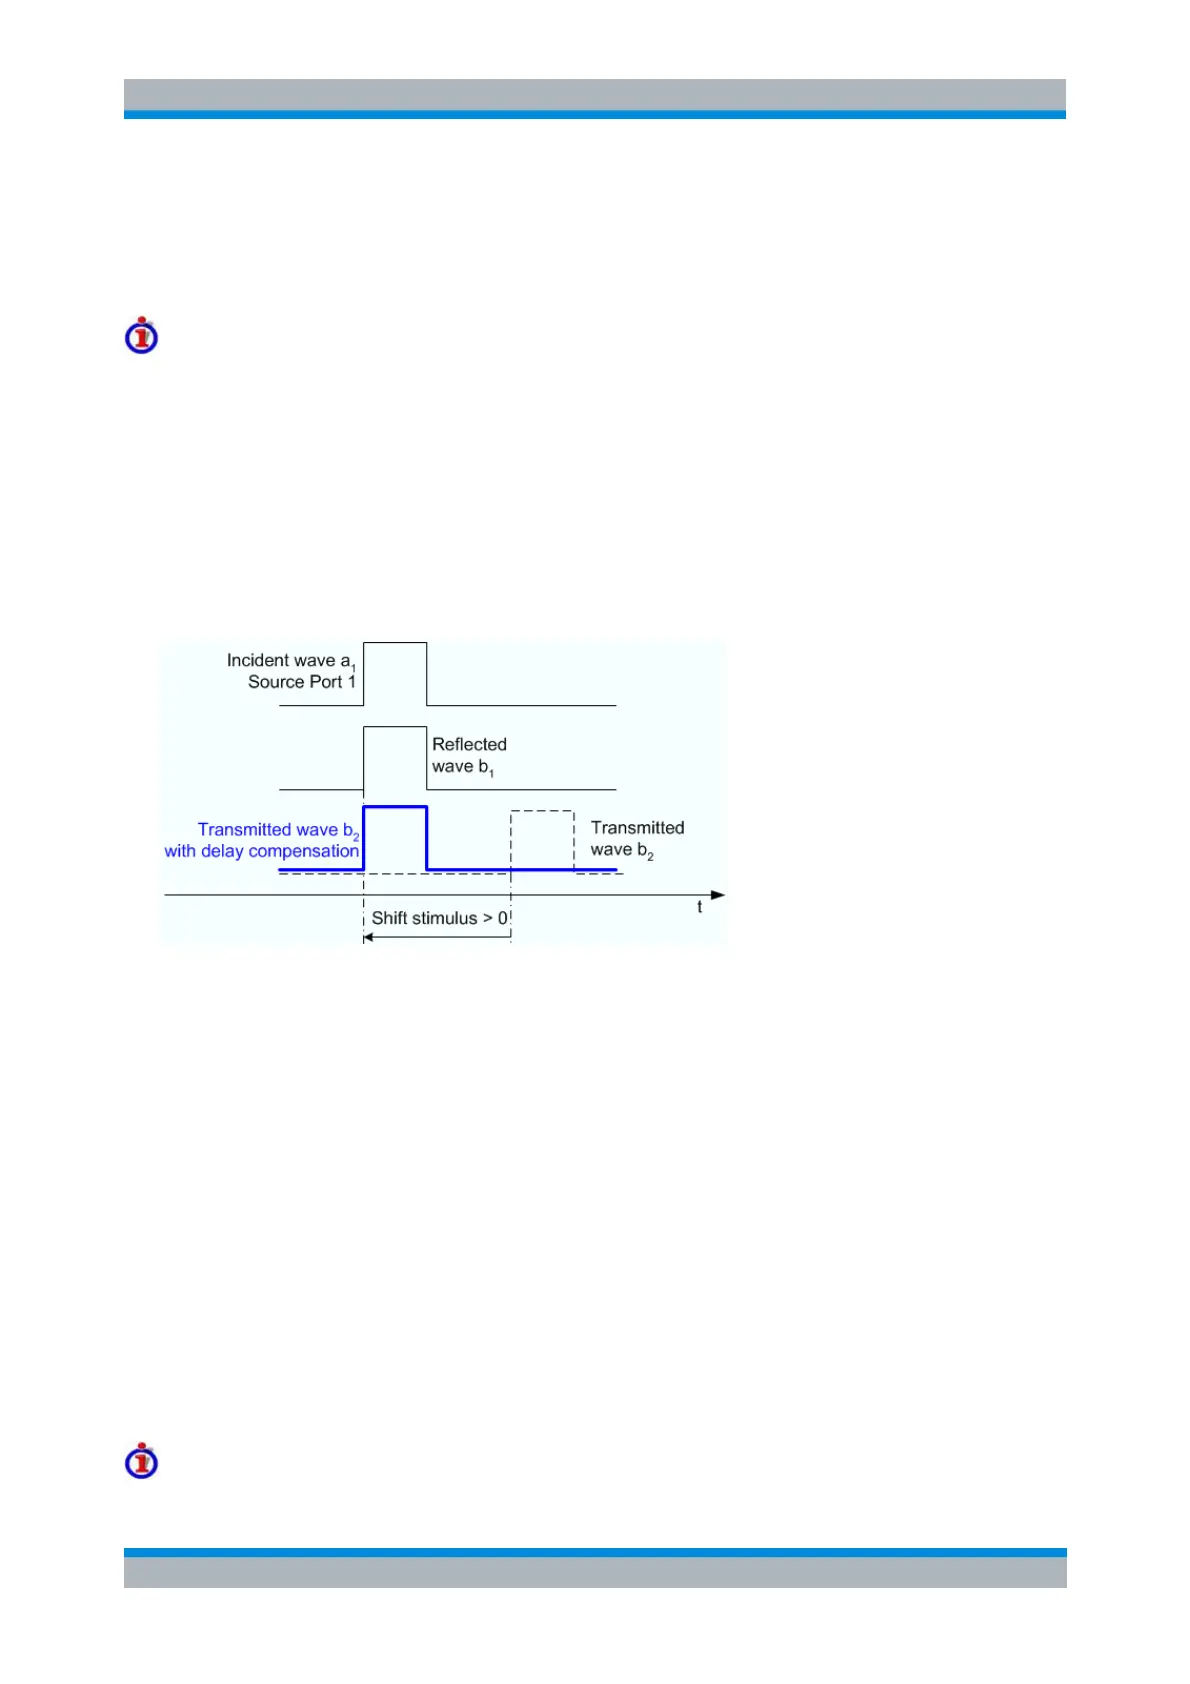
Shift Stimulus defines an offset time that is to compensate for a known transmission delay of a DUT. A
non-zero shift stimulus value has the following effect:
The trace for the wave quantity assigned to the active receiver is shifted in horizontal direction. A
positive value shifts the trace to the left (subtraction of a known delay), a negative value shifts it to
the right.
All quantities depending on the shifted wave quantity are calculated with the corrected time
reference. In the example below, the S-parameter S
21
is calculated as S
21
(t) = b
2
(t + <Shift
stimulus>)/a
1
(t).
The displayed Recording Time is extended to cover the delayed wave.
The example above illustrates the importance of a correct delay compensation for the calculation of S-
parameters, ratios and other derived quantities in the time domain. Without compensation, the two pulses
for a
1
and b
2
do not overlap so that no meaningful S-parameter calculation is possible.
Example: S-parameter measurement for a DUT with known delay D
fw
and D
rev
in forward and reverse
direction. The DUT is connected between port 1 and port 2 of the analyzer. The test setup is fully
calibrated so that the reference planes are at the DUT's input and output ports.
Receiver: a1
Source: 1
Shift stimulus: 0
Receiver: b1
Source: 1
Shift stimulus: 0
Receiver: b2
Source: 1
Shift stimulus: D
fw
Receiver: a2
Source: 2
Shift stimulus: 0
Receiver: b1
Source: 2
Shift stimulus: D
rev
Receiver: b2
Source: 2
Shift stimulus: 0
The Evaluation Mode specifies how the wave quantity assigned to the current receiver and source
port is displayed. In Normal mode, it is displayed as measured (pulse shape). If Mean Value of
Pulse Section is selected, the wave quantity is replaced by its mean value (magnitude and phase)
averaged over a configurable time interval [Section Start, Section Stop].
Effect of averaging, definition of the time interval