2
INSIGHT Software
Operation
Thermo Scientific Evolution 200 Series User Guide 33
Enter values in any special columns that were specified on the Samples tab in Settings.
These values may appear in the rate data report.
7. Click Continue.
8. Follow the instructions that appear.
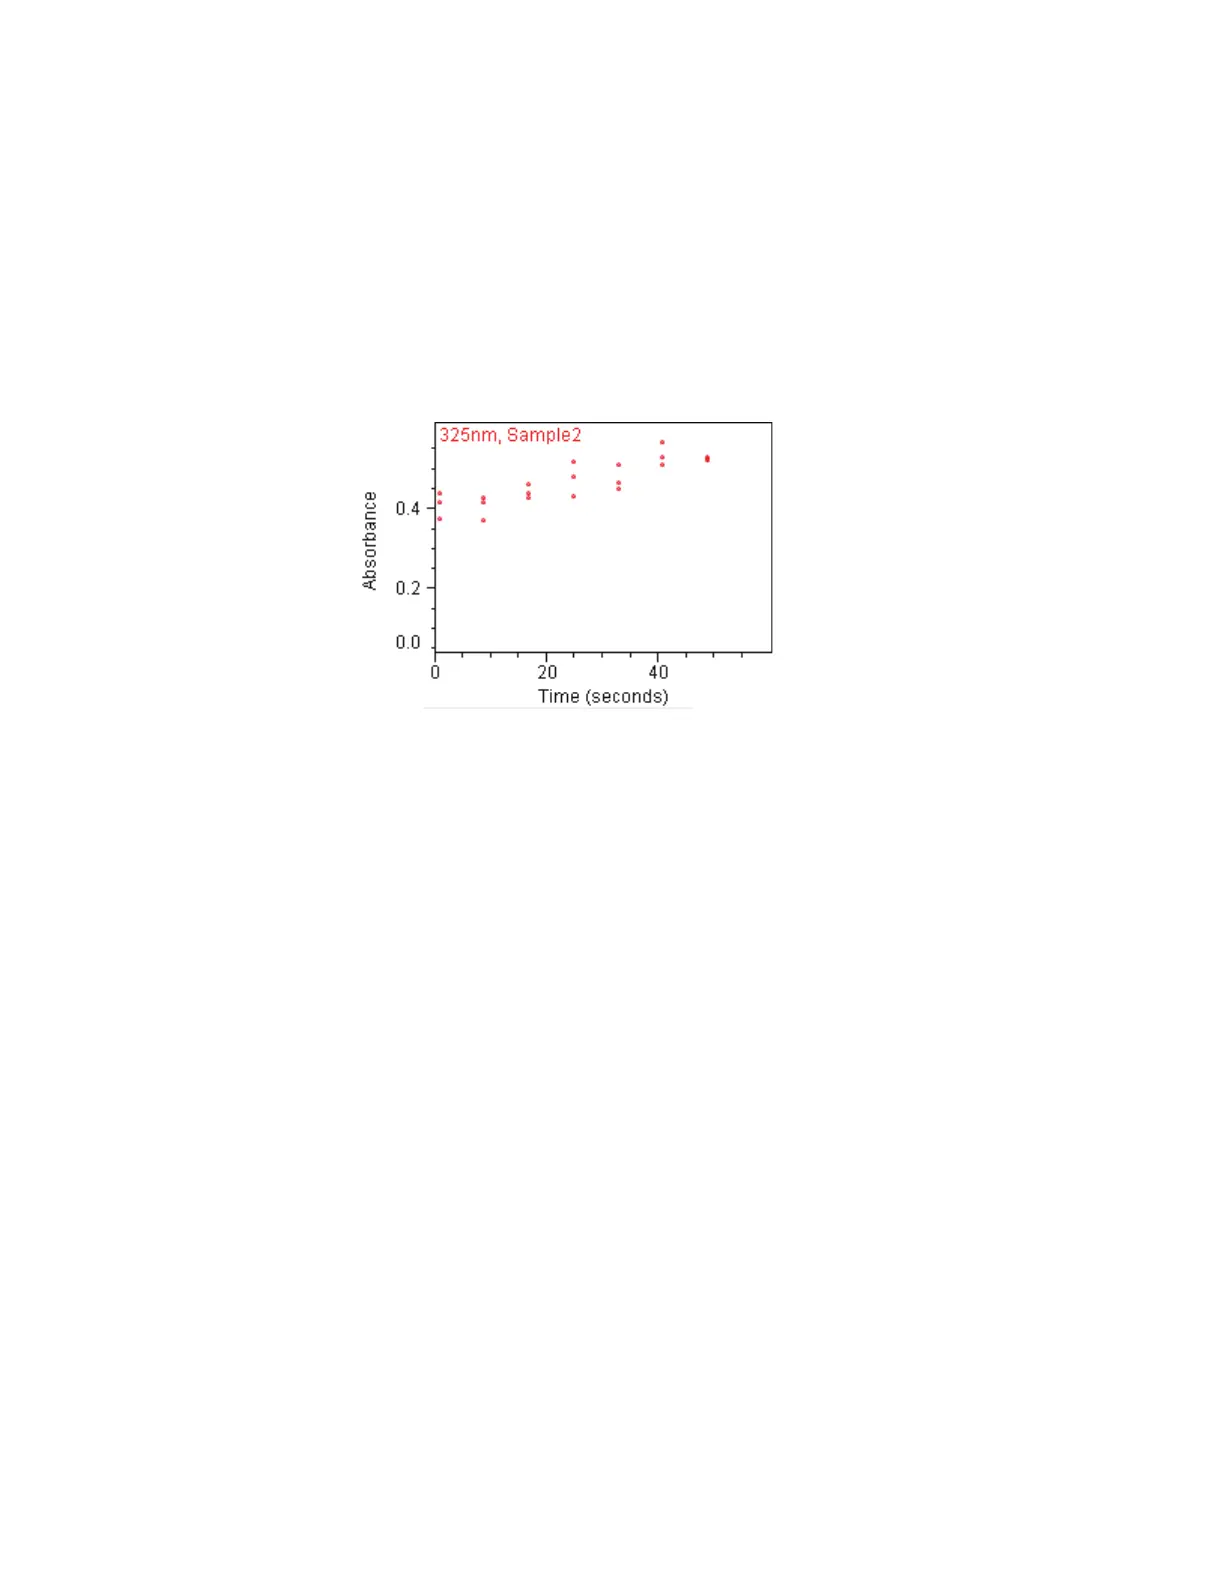
Each row on the Data tab shows the measurement results for a single sample, and each
column is for one wavelength. Each plot on the tab shows a sample’s spectral intensity
measured at a particular wavelength over time.
Scroll bars are provided if plots are out of view.
Right-click the Data tab to access features for changing the scale or adding annotation.
See Data Display for more information.
The results table contains the columns of information specified on the Configuration tab
in Reports.
9. To perform rate calculations or modify existing rate calculations on the data in a plot,
double-click it.
More:
A dialog box displays the plot and a table containing the default rate calculation values
based on the Rate Calculations tab in Settings.
a. If desired, add or change sets of rate calculation values for the displayed data. Each set
represents a curve that describes the rate behavior over the specified time period.
To delete a row from the table, right-click it and choose Delete Selected Row. To
delete all the information from the table, right-click it and choose Clear Table.
b. Click Update to generate kinetic rate models, each of which appears as a line across
the data.