2
INSIGHT Software
Operation
Thermo Scientific Evolution 200 Series User Guide 43
Result mode Determines how results are calculated and displayed:
Normal displays the results in the units specified in the Data mode
setting (see above).
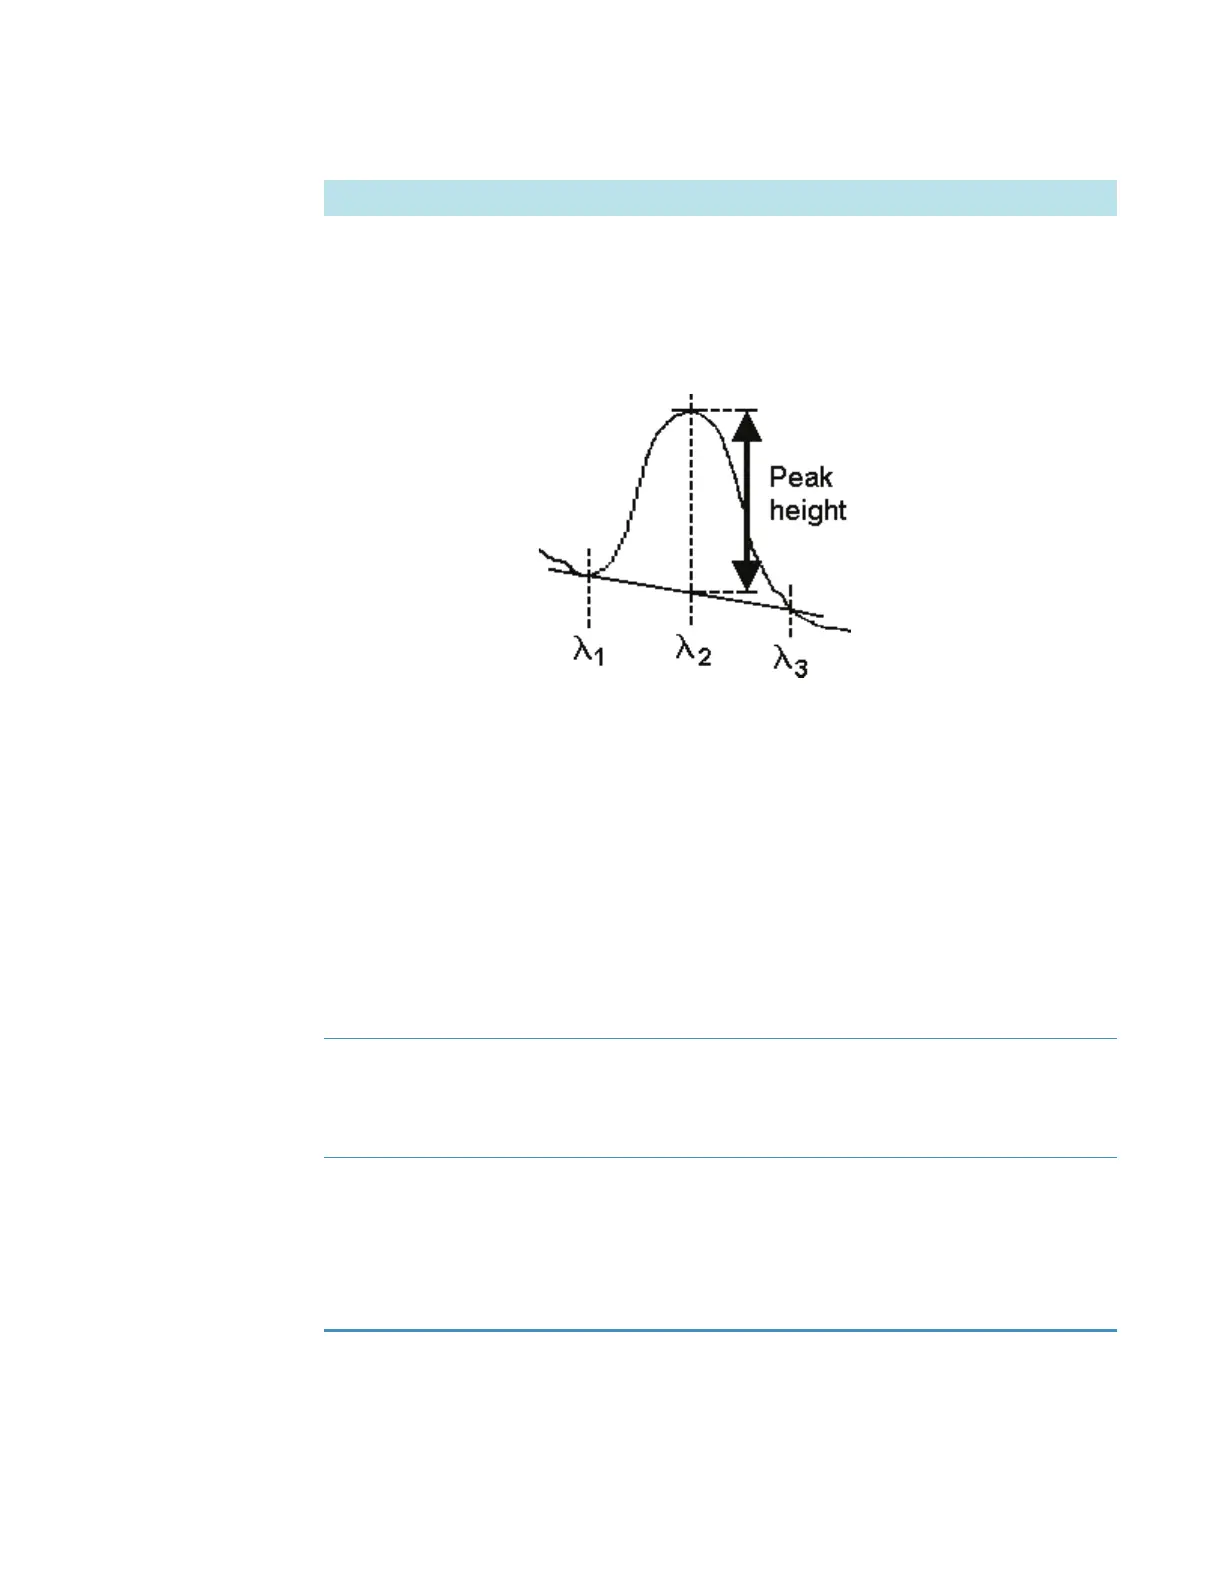
Peak Height calculates the peak height with respect to a sloping
baseline defined by two wavelengths adjacent to the center peak:
The lowest of the three measured wavelengths defines the start of
the sloping baseline, the middle wavelength defines the peak
location, and the highest wavelength defines the end point of the
sloping baseline.
Wavelength 1 + Wavelength 2 adds the Y values at the two
measured wavelengths.
Wavelength 1 - Wavelength 2 subtracts the Y value at the second
measured wavelength from the Y value at the first.
Wavelength 1 / Wavelength 2 divides the Y value at the first
measured wavelength by the Y value at the second.
Reference wavelength
correction
If available and selected, subtracts the background intensity at the
specified reference wavelength from the sample intensity at all
measured wavelengths. The reference wavelength value appears in
red in the table of wavelengths.
Use control limits If available and selected, specifies the control limits for each
wavelength in the table. The limits, shown as triangular markers in
the data display (and listed in the table to the right of the display),
indicate whether each measured data point is within specification.
Enter the desired upper and lower limits for each wavelength in the
table, using the appropriate units for the selected data mode.
Feature Description