The most important columns of the tables are the varied main parameters
Burst
size
and
Frame size
and the performance parameter
Frames lost
.
The order of the tables will vary depending on the test mode and the relation of the ports.
Refer to the table in "Throughput" subsection of "Test Results".
66..99..33..77 Event LogEvent Log
Touching the Event LogEvent Log button in the navigation area displays the screen
providing the event log data. Refer to Event Log of SDH/SONET/PDH/DSn
BERT application.
66..99..33..88 StatisticsStatistics
Touching the StatisticsStatistics button in the navigation area displays the screen
providing the statistics data. Refer to Statistics of Mon/Gen for the operation.
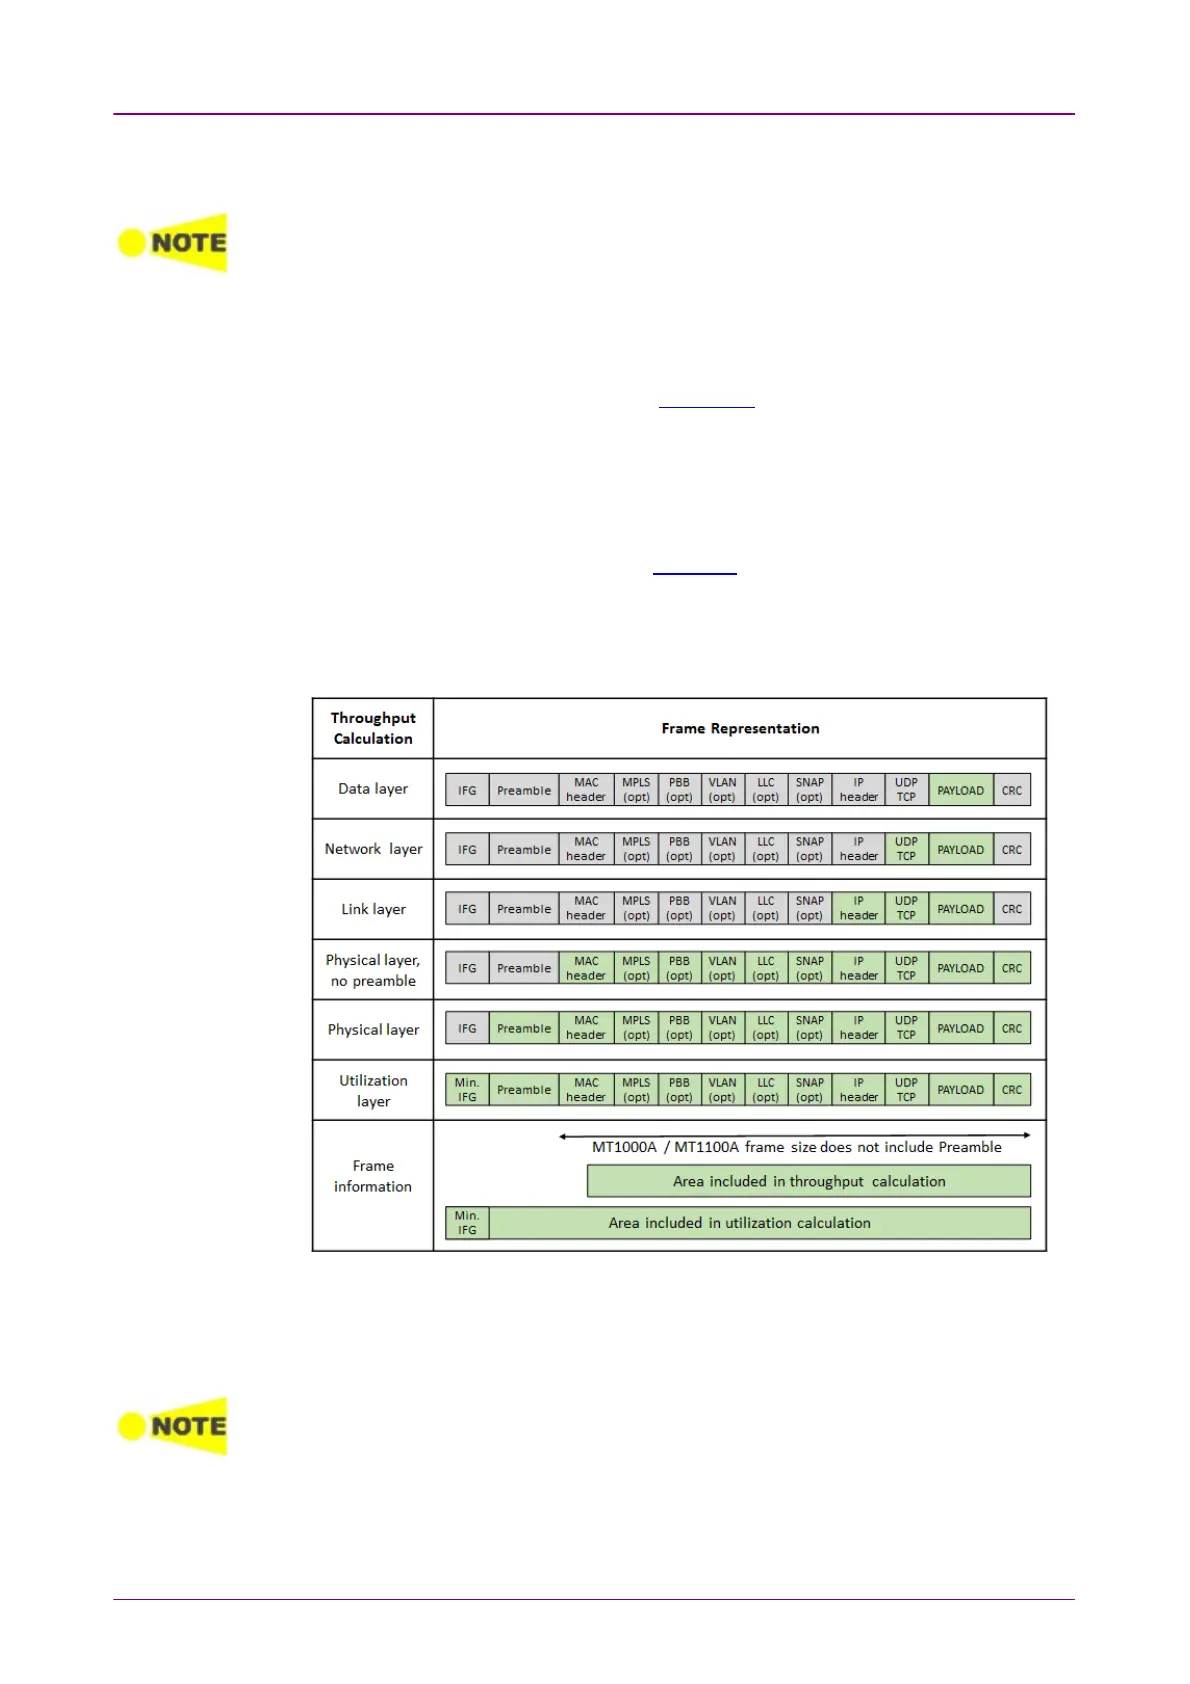
66..99..44 Throughput CalculationThroughput Calculation
Throughput may be calculated on 6 different layers.
Each calculation is done on a one second base. It is possible either to register
the maximum throughput (actually showing only the second with the highest
throughput), or to register an
average throughput per second
taken over a
selected part of the test period.
The calculation depends on the setting of the transmitted frame contents. Even in cases
where the transmitter is not used, the calculation will be based on this setting.
The part of the test from which the average throughput is calculated, is selected
in a way to avoid influence from latency and missing frames. The drawing
below illustrates this.