DRAFT
September 1, 2004 11:39 am, CH_Run.fm
Chapter 3 Preparing a Run
3-6 Applied Biosystems 7900HT Fast Real-Time PCR System and SDS Enterprise Database User Guide
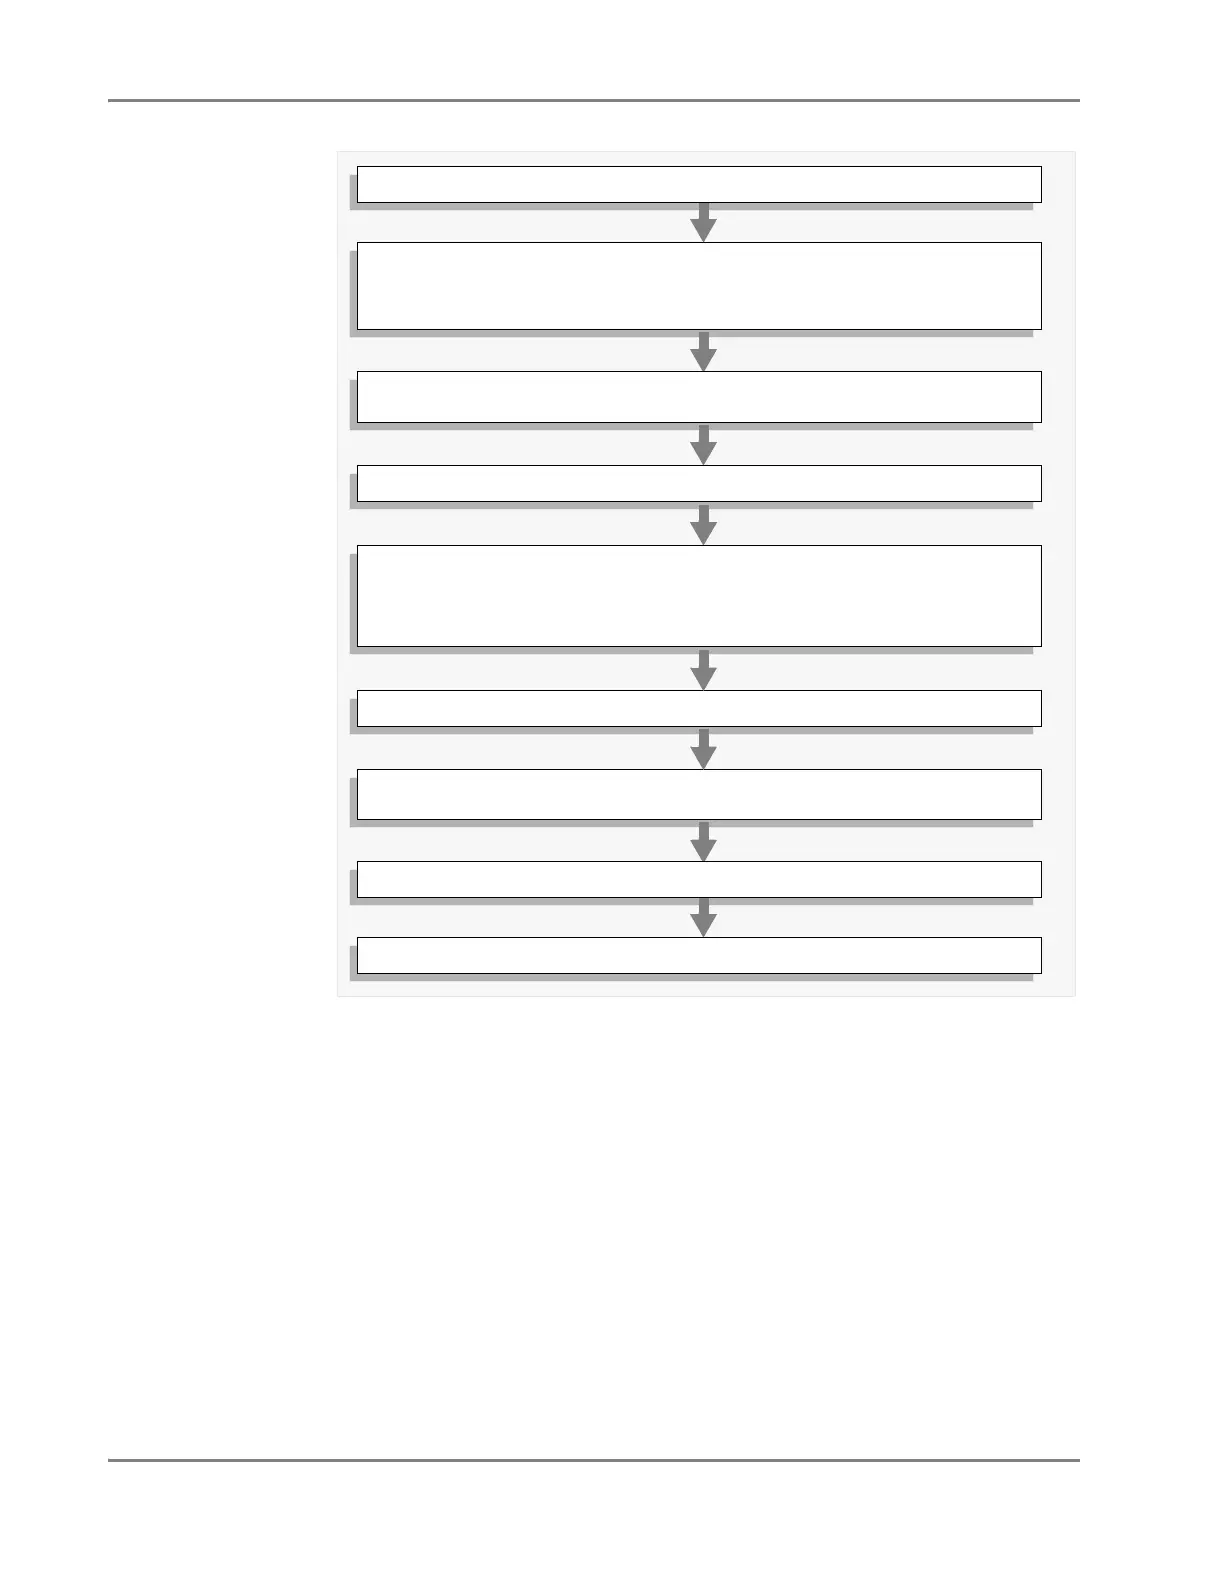
Relative
Quantification
Workflow
Dissociation
(Melting) Curve
Workflow
The SDS software can perform a dissociation curve analysis as part of an absolute
quantification run. Therefore, to perform a dissociation curve, construct a plate
document for absolute quantification as explained on page 3-5 and configure the
method with a temperature ramp as explained on page 3-23.
1. Create a relative quantification plate document (see page 3-9).
2.
*
Apply detectors to the plate document:
a. Create detectors for the relative quantification probes (see page 3-11).
b. Copy the detectors to the plate document (see page 3-13).
3.
*
Configure the plate document with detector tasks (NTC and Unknown)
(see page 3-16).
4.
*
Program the method for the relative quantification run (see page 3-19).
5. Choose from the following:
– If running a single plate, then continue to step 2.
– If running the first plate in a series of plates with identical assay
configurations, then save the plate document as a template (see page 3-24).
6. Create a plate document from the template created in step 2 (see page 3-26).
7. Configure the document with sample names and plate information (see
page 3-28).
8. Prepare and run the relative quantification plate or plates (see page 4-1).
9. Analyze the run data (see page 6-15).
*Steps 2 and 2 can be eliminated by importing the plate document setup information
from a tab-delimited text file. See “Importing Plate Document Setup Table Files”
on page A-2 for more information.