Tuning D1 Servo Drive User Manual
6-18 HIWIN MIKROSYSTEM CORP.
6.5.3 Calculation functions
Plot view window provides some calculation functions, such as integration, differentiation, addition and
multiplication, etc. User can directly calculate in Plot view window. Besides, Plot view window also
provides the maximum value, the minimum value, ripple calculation and spectrum analysis of physical
quantity.
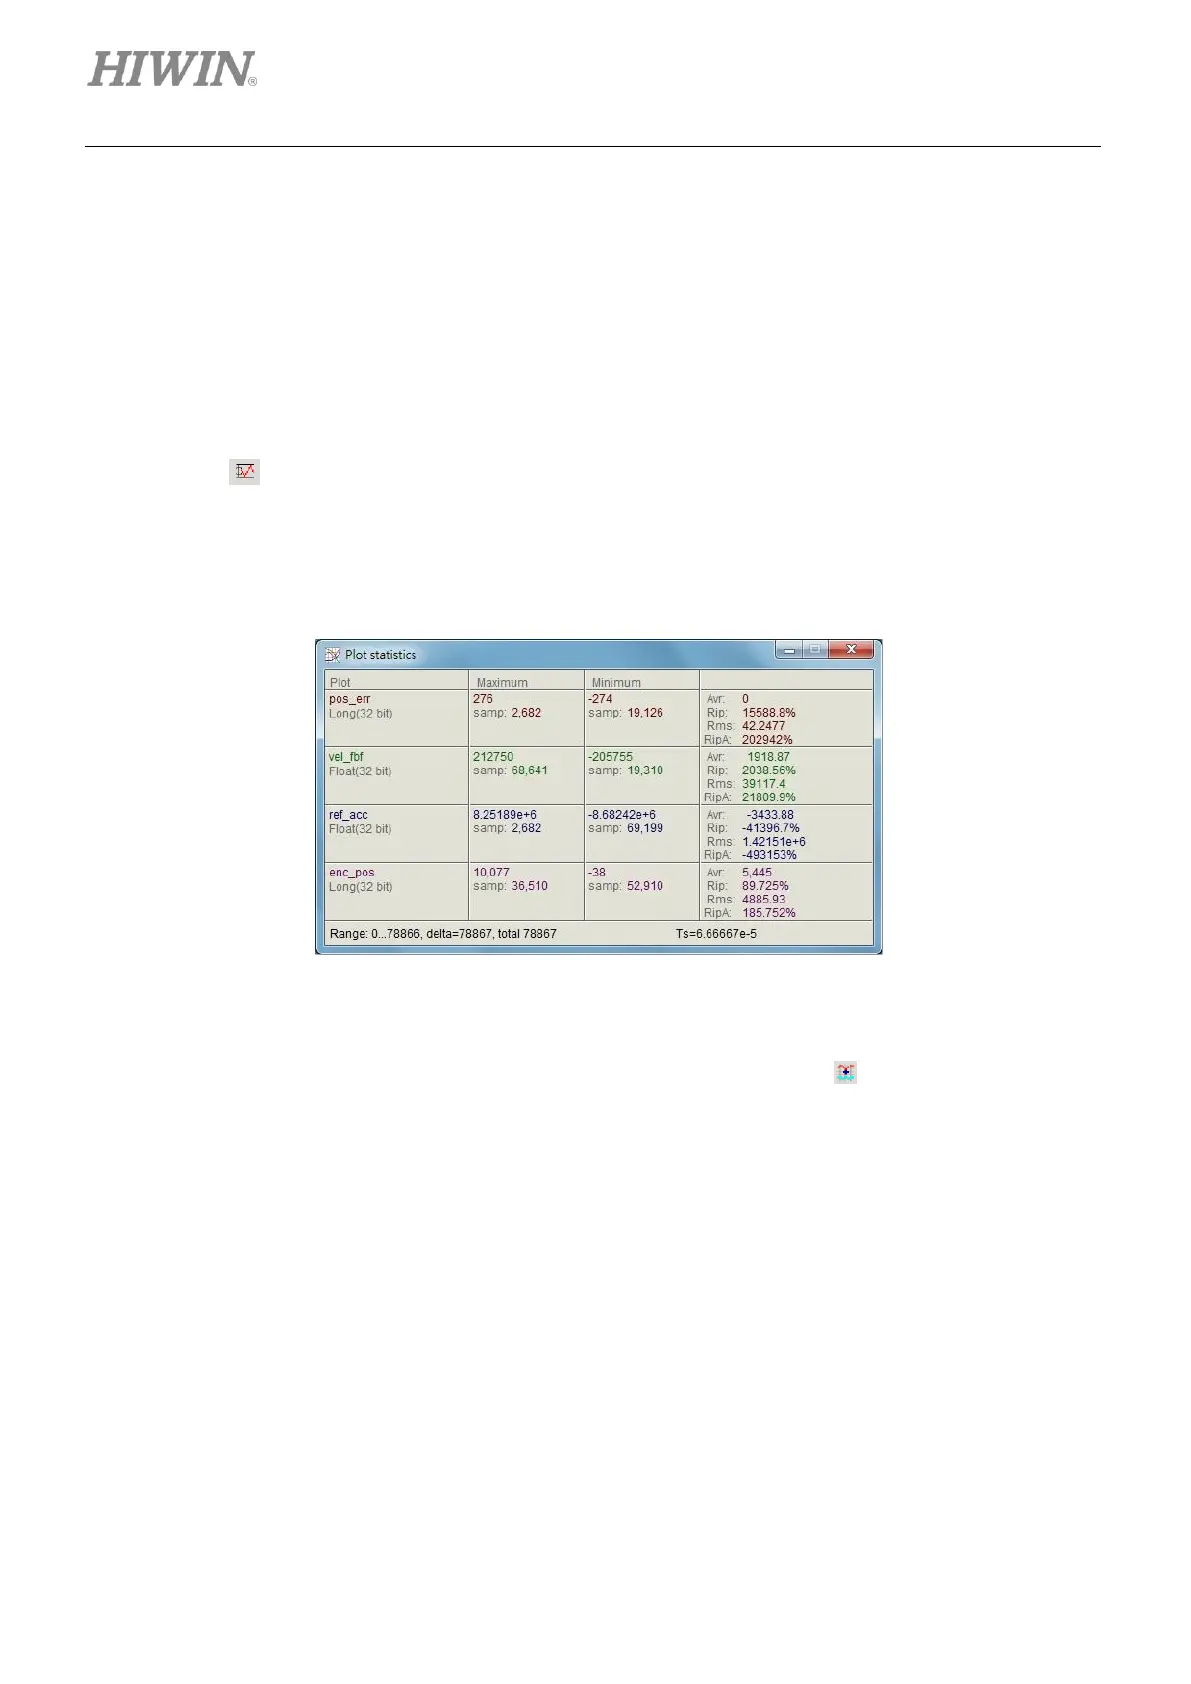
(1) Plot statistics window
Click on to show Plot statistics window. The window will show the maximum value, the
minimum value, average value, root mean square (Rms), Rip (standard deviation/average value)
and RipA (the maximum value-the minimum value/average value) of the physical quantity in the
selected segment.
Figure6.5.3.1 Plot statistics window
(2) Calculation function
Click on Tools on the menu bar and select Math operation or click on to open Math operation
window, as figure 6.5.3.2. Take adding two physical quantities as an example here. Select Linear
and select pos_err and vel_fbf from the drop-down list. Set name and color in New plot name field.
After that, click on Create button to create a new graph, as figure 6.5.3.3.