23.7 Curves
■■■■■■■■■■■■■■■■■■■■■■
186
■■■■■■■■
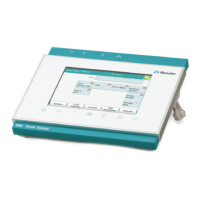
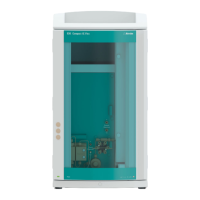
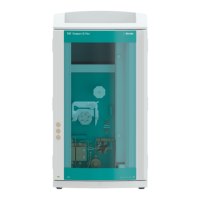
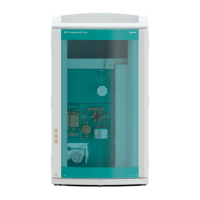
917 Coulometer
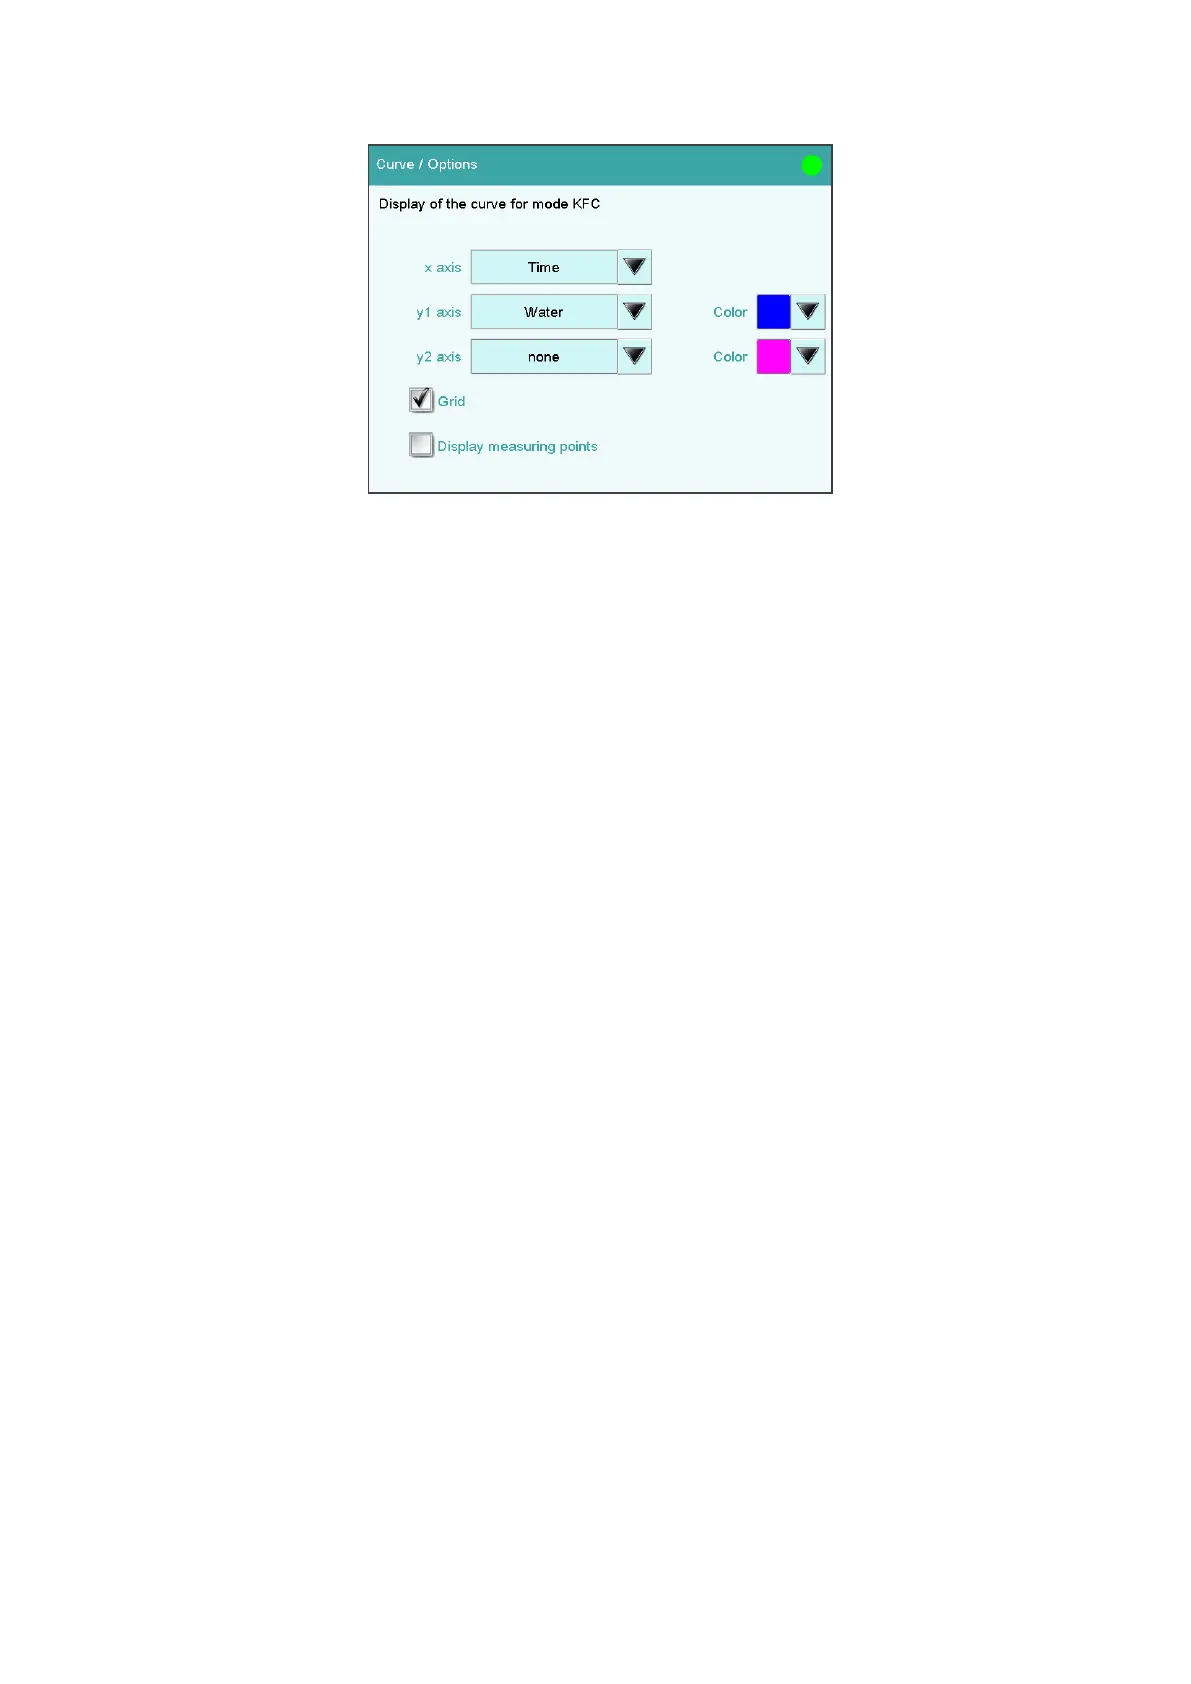
You can make the settings for the curve display in the Curve / Options
dialog. These settings are saved separately for each mode (KFC, MEAS,
etc.) and also apply for the live display. Both the selection of the quantities
and the default setting depend on the mode.
x axis
Quantity which is shown on the x axis of the graph.
y1 axis
Quantity which is shown on the y1 axis of the graph.
y2 axis
Quantity which is shown on the y2 axis of the graph.
Color
Selection of a color for the curves.
Grid
on | off (Default value: on)
If this parameter is activated, grid lines are shown.
Display measuring points
on | off (Default value: off)
If this parameter is activated, the curve is shown with the single measured
values.