Chapter 2 Troubleshooting Your Library
Viewing Ticket Details
Scalar i2000 User’s Guide 45
Generating the Tickets
Report 2
The Tickets Report lets you see how many tickets occurred in a particular
time period. You can choose to group tickets by subsystem, module, or
FRU, and the results can be presented as a rollup summary or as a trend
so you can see if the number of issues is increasing or decreasing over
time. Also, the report results can be presented in different chart formats,
such as bar graphs or pie charts.
After generating a report, you can print it or save it as a PDF file. In
addition, you can save a set of report criteria as a template for reports you
frequently generate.
Specifying Tickets Report Criteria 2
To generate the Tickets Report, first specify the report criteria, and then
view the report.
1 Log on as an administrator.
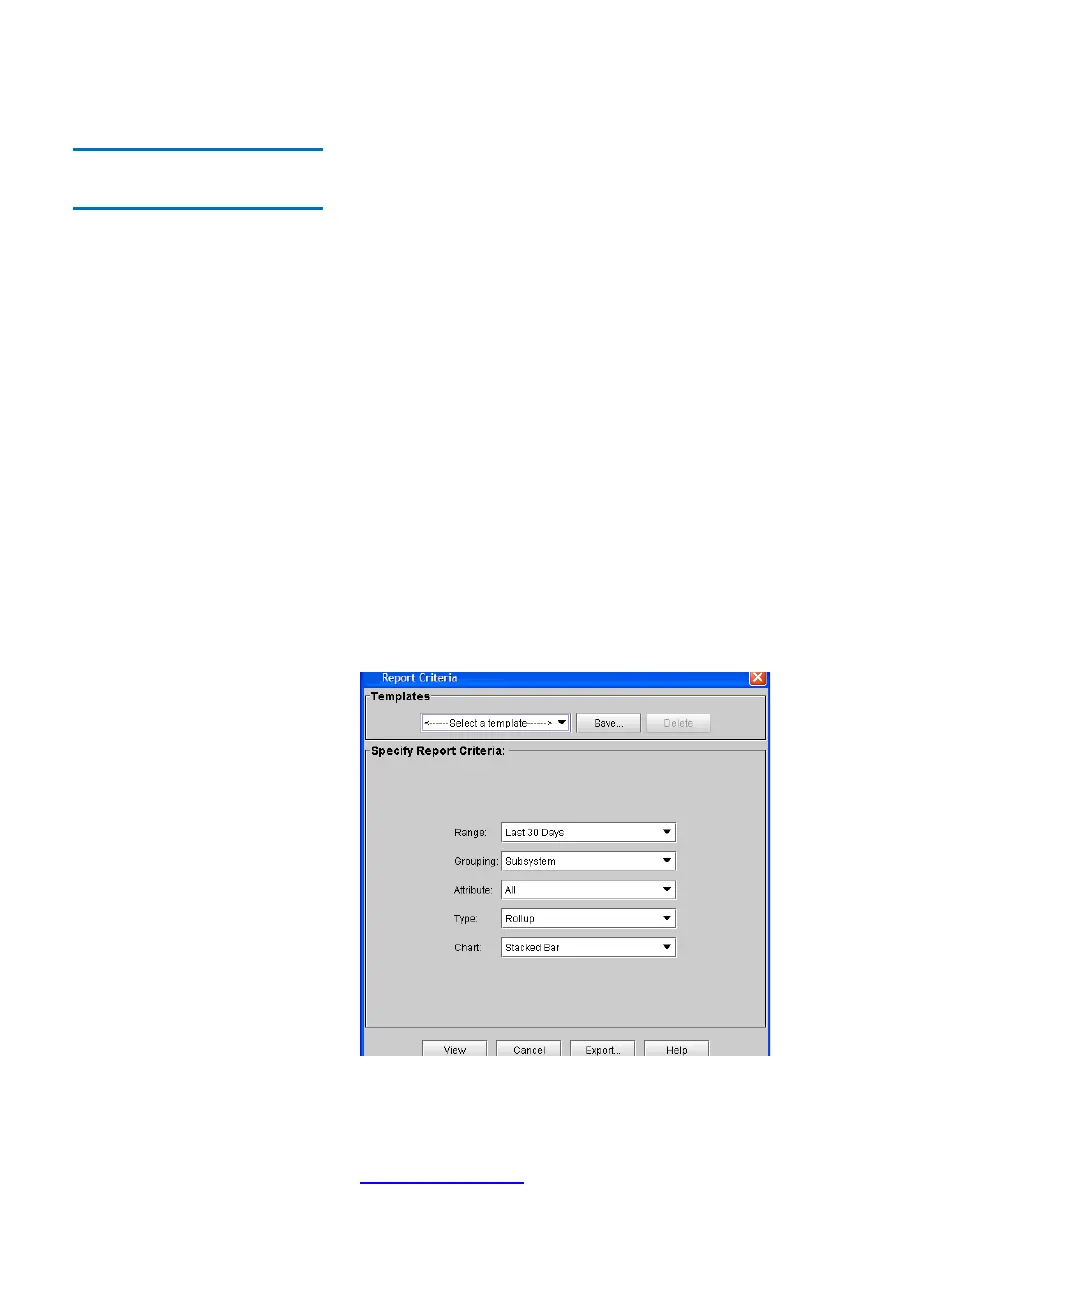
2 On the menu bar, click Tools→ Reports→ Tickets.
The Report Criteria dialog box appears.
3 Under Specify Report Criteria, click criteria options in the lists to
customize the content and appearance of the Tickets Report.
Table 3 on page 46 summarizes the available report criteria options.