R&S
®
ZVA / R&S
®
ZVB / R&S
®
ZVT GUI Reference
Trace Menu
Operating Manual 1145.1084.12 – 30 204
All marker formats are available irrespective of the measured quantity. The output values are calculated
by a simple conversion of a complex measurement result, where the marker format defines the conversion
rules. This flexibility in the calculation must be kept in mind when interpreting the results and physical units
displayed; see also Measured Quantities and Display Formats.
Note that the calculation of interpolated marker values is based on the current trace format, so changing
the trace format may also affect the displayed marker values.
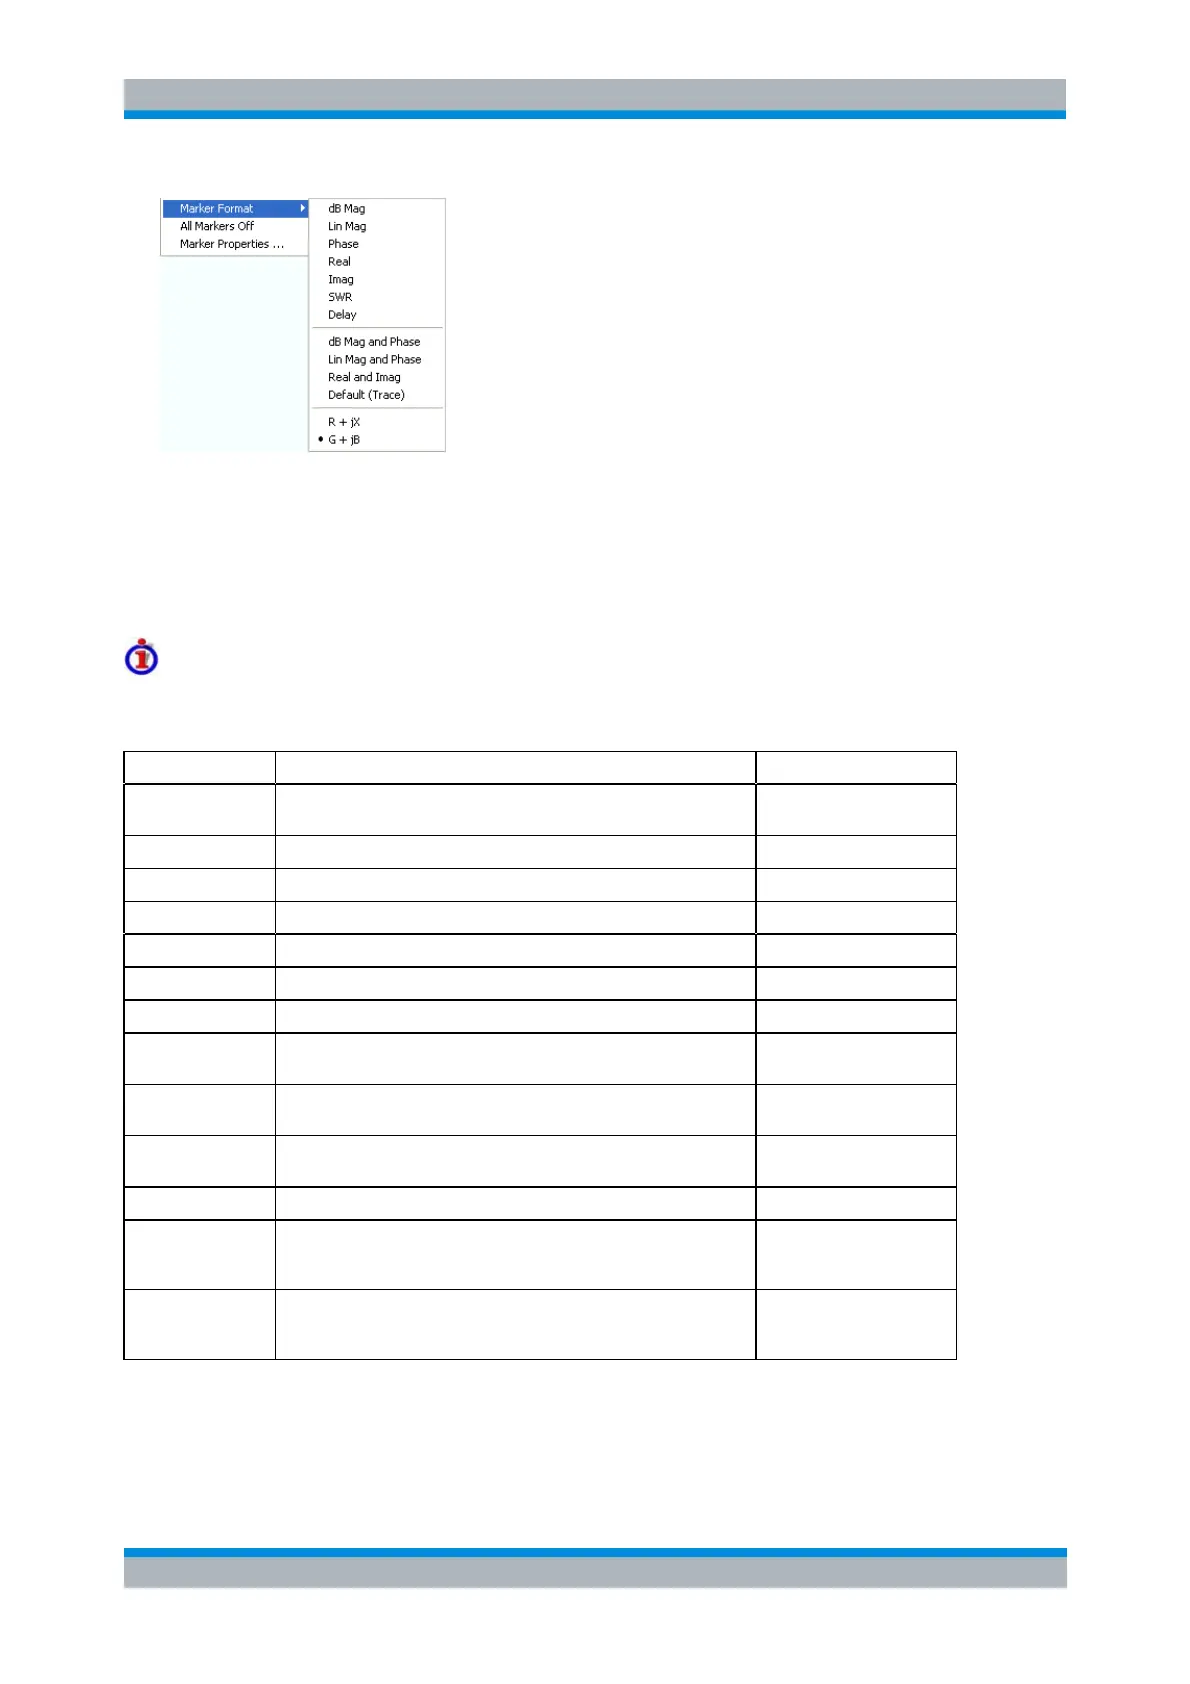
Short description of marker formats
The formats of the markers assigned to a trace are independent of each other and of the trace format
settings. The following table gives an overview on how a complex marker value z = x + jy is converted.
|z| = sqrt ( x
2
+ y
2
)
dB Mag(z) = 20 * log|z| dB
Magnitude of z, unconverted
(Voltage) Standing Wave Ratio
SWR = (1 + |z|) / (1 – |z|)
Group delay, neg. derivative of the phase response*
)
Magnitude of z in dB and phase in two lines
20 * log|z| dB
arctan ( Im(z) / Re(z) )
Magnitude of z (unconverted) and phase in two lines
|z|
arctan ( Im(z) / Re(z) )
Real and imaginary part of z in two lines
Marker format identical with trace format
Unnormalized resistance and reactance; L or C in three lines
(Smith diagram)
Unnormalized conductance and susceptance; L or C in three lines
(Inverted Smith diagram)
*
)
The delay aperture is defined in the Trace – Format menu.
**
)
The equivalent inductances or capacitances L or C are calculated from the imaginary part of the
impedance according to