Upgrade/Backup, and click the corresponding buttons in the lower left- hand
corner.)
System Monitor panel
Graphs are displayed for:
Board Temperature
Memory Used
CPU Used.
To delete the logged data used to generate the displayed graphs, click the
TRASHCAN icon. (Note that re-populating the graphs with fresh data generated
at a 1/min. rate will take several minutes.)
To download the logged data in .csv format, click the ARROW icon.
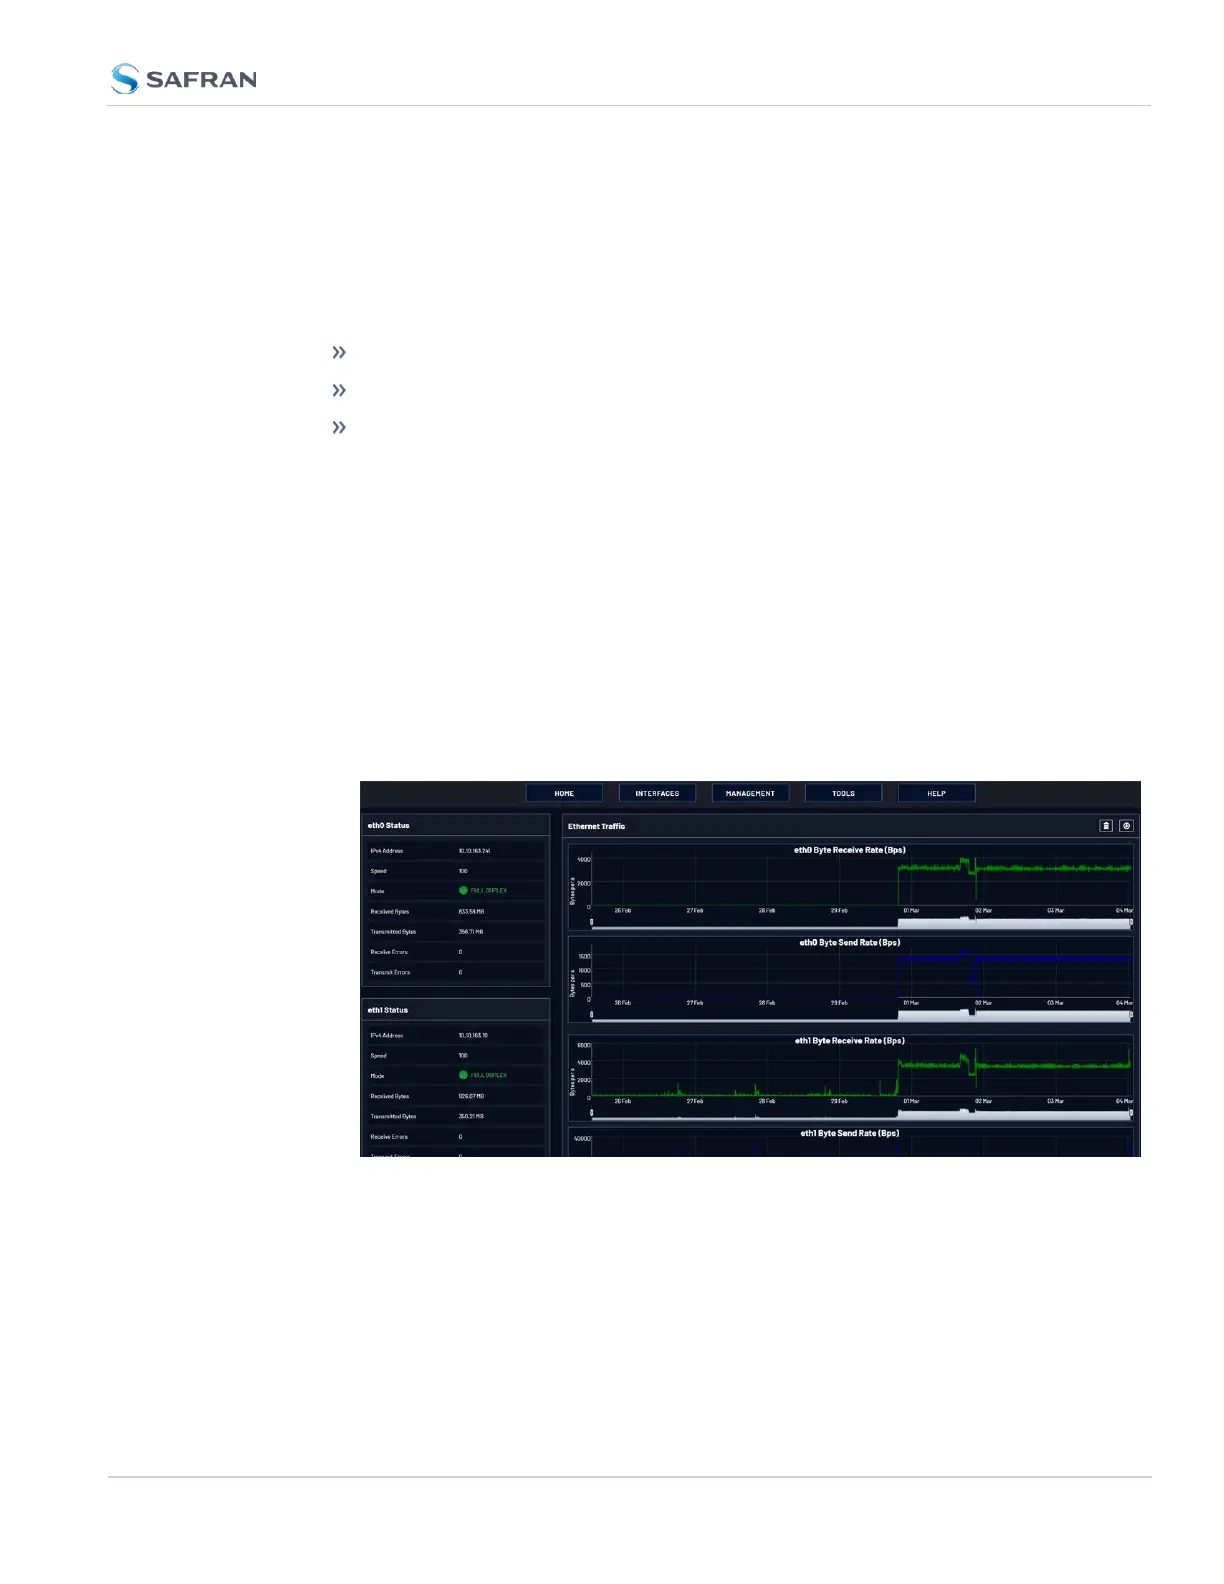
4.6.1.2 Ethernet Monitoring
To monitor Ethernet status and traffic:
1. Navigate to TOOLS > SYSTEM: Ethernet Monitor. The Ethernet monitoring
screen opens:
The data displayed is linked to a specific Ethernet port e.g., ETH0. If you enable
additional Ethernet ports, their throughput data will also be displayed.
In the Traffic pane on the right the traffic throughput in Bytes per second is dis-
played in two graphs. Drag the handles at the bottom of the graphs to zoom in
on a particular time frame.
In the Actions panel on the left, you can clear or download monitoring data.
4.6 Quality Management
CHAPTER 4 • VersaSync User Manual Rev. 12
271