2
INSIGHT Software
Operation
Thermo Scientific Evolution 200 Series User Guide 39
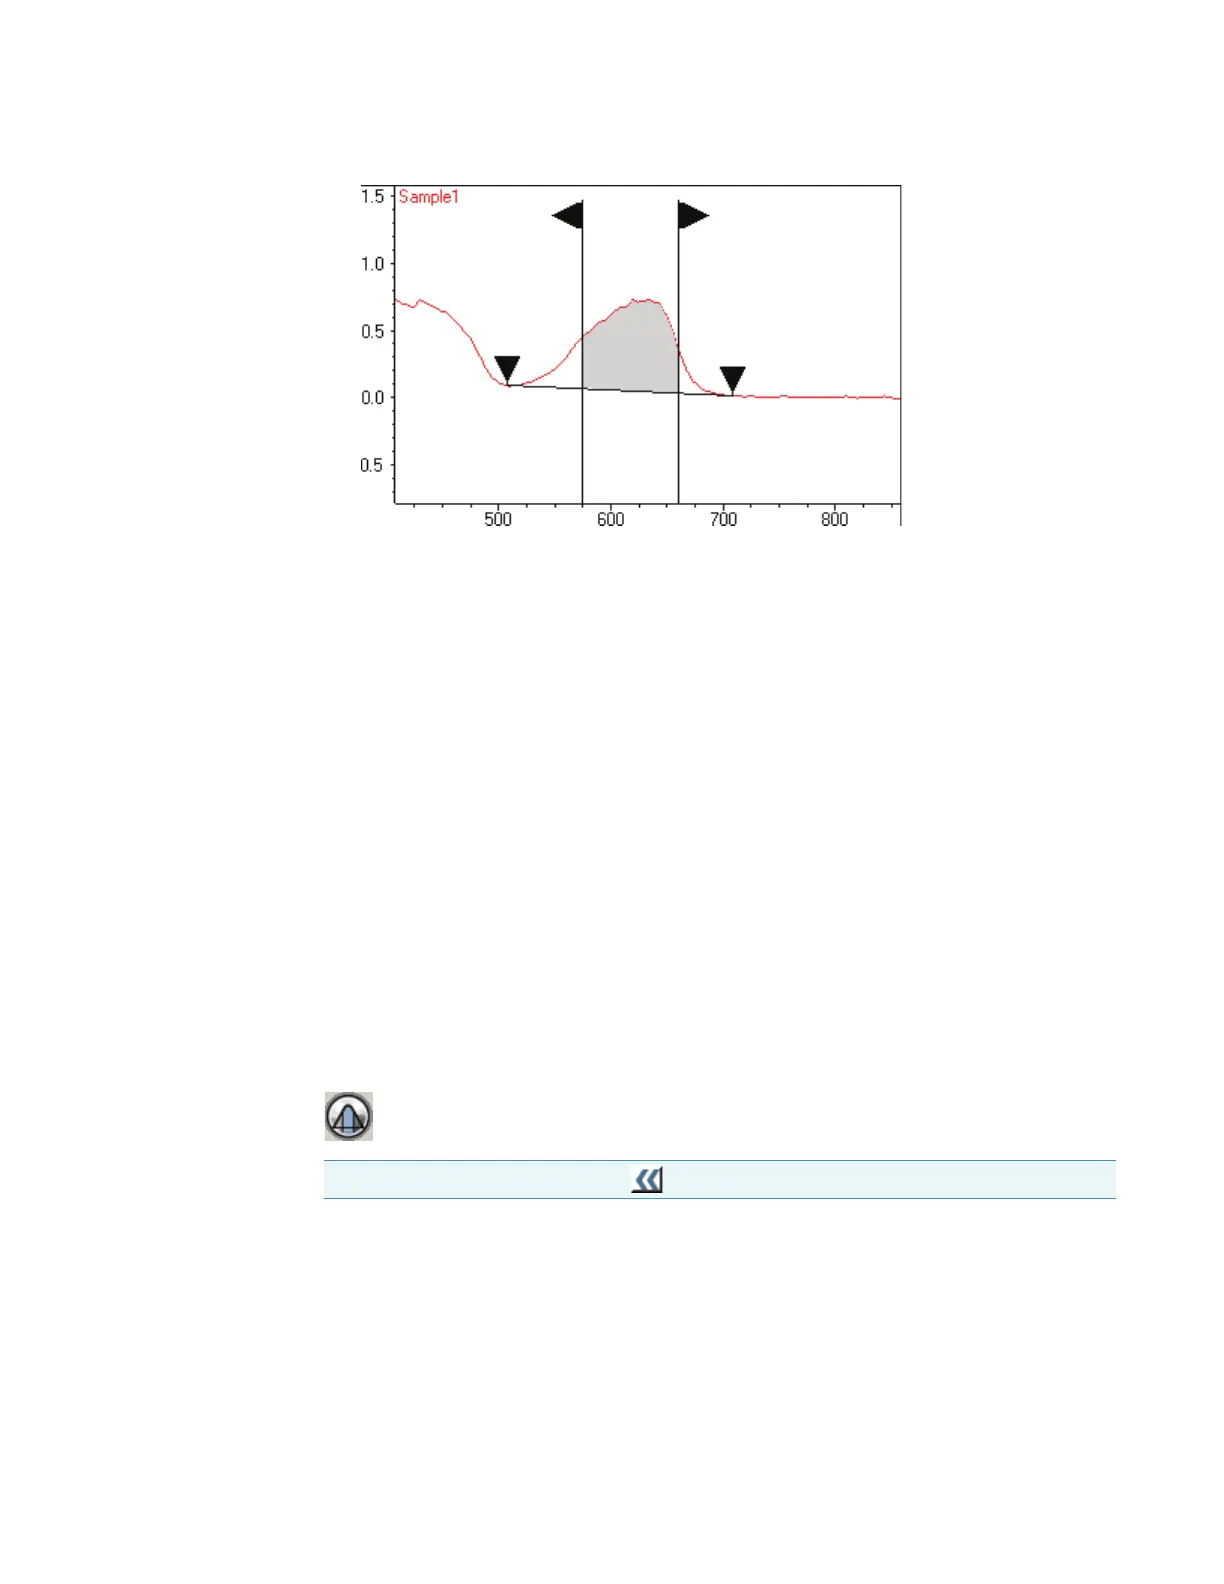
To annotate the spectrum with the measured area, right-click the spectrum, point to
Annotate and choose To ol Va l u e. See Working With Labels.
To remove the vertical lines and baseline from the display, select another tool such as the
selection tool.
Related Topics
Using the Selection Tool
Using the Spectral Cursor Tool
Using the Peak/Valley Measurement Tool
Using the Region-Threshold Tool
Using the View Finder
Using the Region-Threshold Tool
For data analysis operations such as locating peaks, use the region-threshold tool (if present)
to limit the wavelength region.
Drag the vertical lines in the data display or drag horizontally between them to move both at
once.
Related Topics
Using the Selection Tool
Using the Spectral Cursor Tool
Note To display the palette, click .