156
Accutome B-Scan Plus User Guide
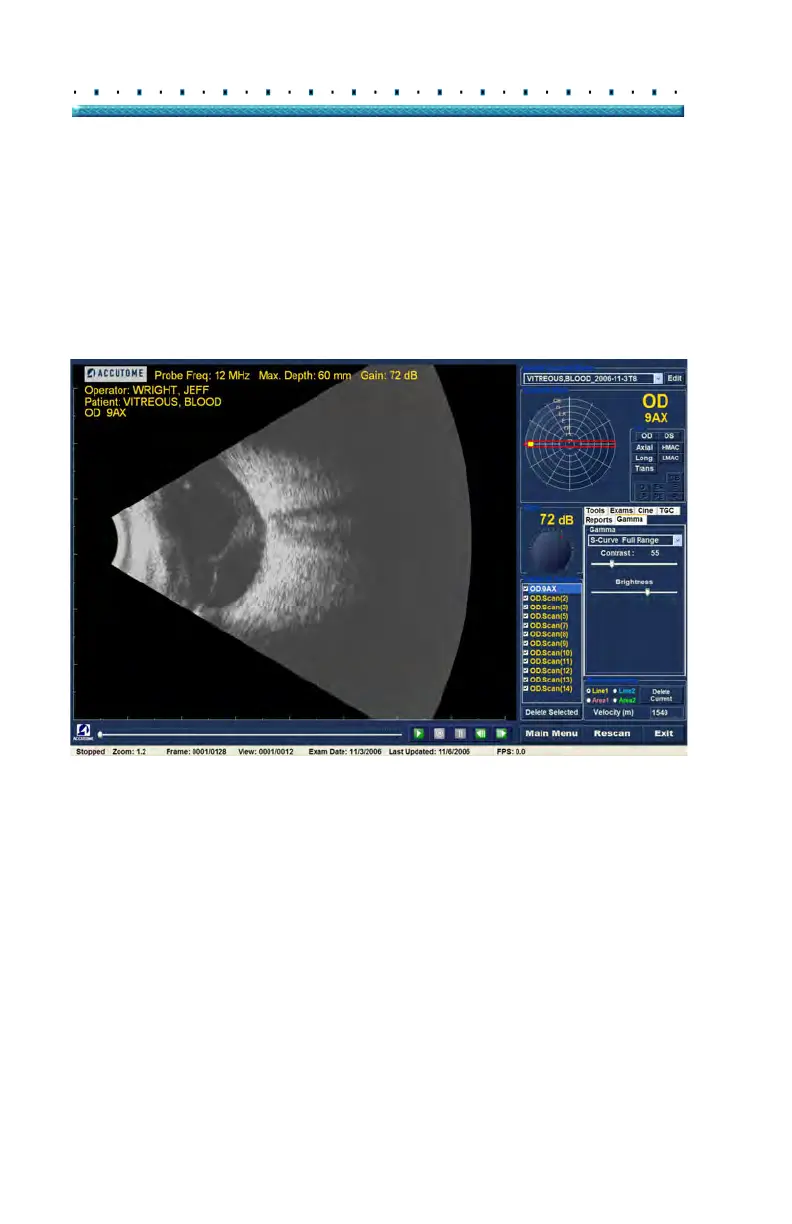
S-Curve
The S-Curve gamma represents a signal to brightness
response, which when plotted, would result in a curve
resembling the shape of the letter "S". The brightness
response differs from Linear and Log in that the image
contains a higher contrast for mid range signals. Figure
120 below displays an example of a B-Scan Plus image
with a S-Curve Full Range gamma setting.
Figure 120 S-Curve Full Range Gamma Setting
Exam Info
Current View
Probe Controls
Scan Controls
All Views
TGC Adjustments
Gamma Adjustments
Edit Exam Info
Zoom Controls