ADOBE AFTER EFFECTS 7.0
User Guide
227
Note: Like the value graph, the speed graph displays x, y, and z (3D only) values in different colors: x values are red, y
values are green, and z values are blue.
You can control the values approaching and leaving a keyframe together, or you can control each value separately.
The incoming handle increases the speed or velocity when you drag it up, and decreases the speed or velocity when
you drag it down. The outgoing handle influences the next keyframe in the same way. You can also control the
influence on speed by dragging the handles left or right.
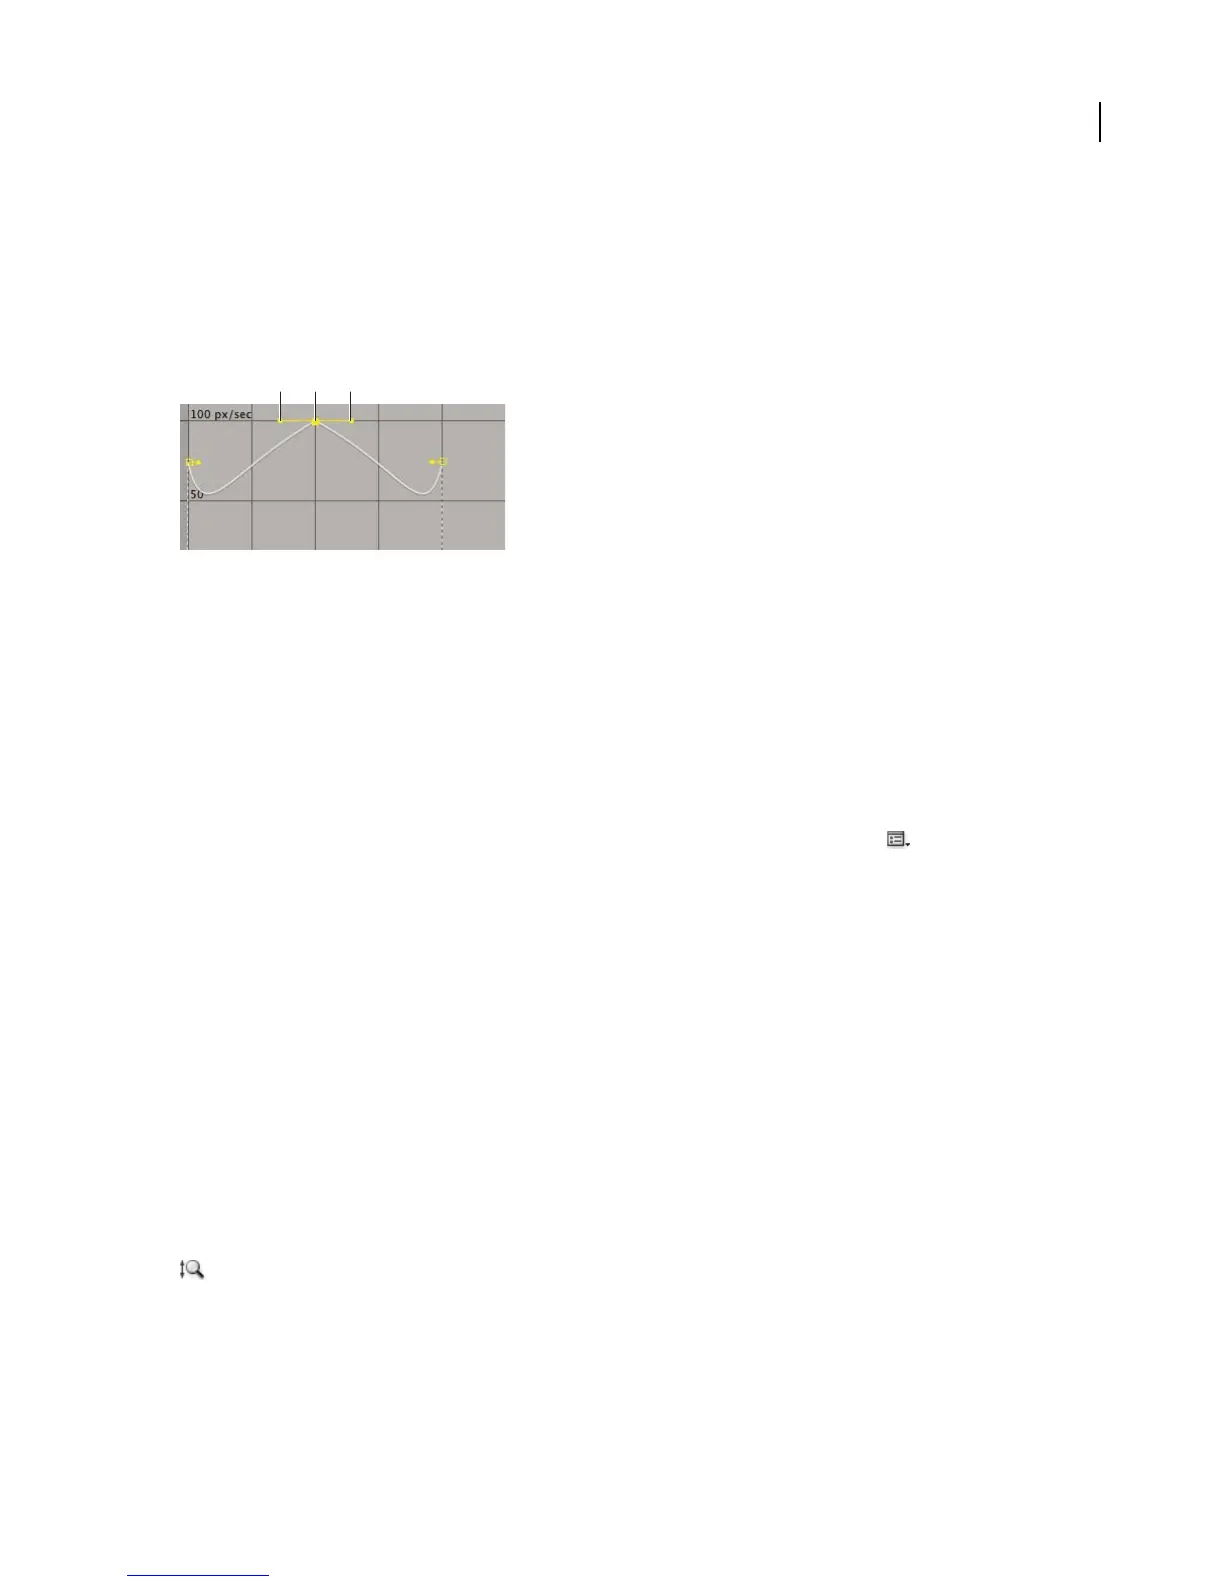
Direction handles in speed graphs
A. Incoming direction handle B. Speed control C. Outgoing direction handle
Note: If you want a handle to have influence over more than one keyframe, use roving keyframes.
See also
“To adjust influence of a direction handle on an adjacent keyframe” on page 229
To adjust incoming and outgoing rate changes
1
In the Timeline panel, expand the outline for the keyframe you want to adjust.
2 Click the Graph Editor button and select Edit Speed Graph from the Graph Options menu .
3 Using the Selection tool, click the keyframe you want to adjust.
4 (Optional) Do one of the following:
• To split the incoming and outgoing direction handles, Alt-drag (Windows) or Option-drag (Mac OS) a direction
handle.
• To join the direction handles, Alt-drag (Windows) or Option-drag (Mac OS) a split direction handle up or down
until it meets the other handle.
5 Do any of the following:
• Drag a keyframe with joined direction handles up to accelerate or down to decelerate entering and leaving the
keyframe.
• Drag a split direction handle up to accelerate or down to decelerate the speed entering or leaving a keyframe.
• To increase the influence of the keyframe, drag the direction handle away from the center of the keyframe. To
decrease the influence, drag the direction handle toward the center of the keyframe.
Note: WhenyoudragadirectionhandlebeyondthetoporbottomoftheGraphEditorwithAutoZoomGraphHeight
on, After Effects calculates a new minimum or maximum value based on how far you dragged outside the graph,
and it redraws the graph so that all the values you specify for that layer property are visible in the graph by default.
A B C