Summary fieldSummary field
List-form informationList-form information
GraphicalGraphical
presentationpresentation
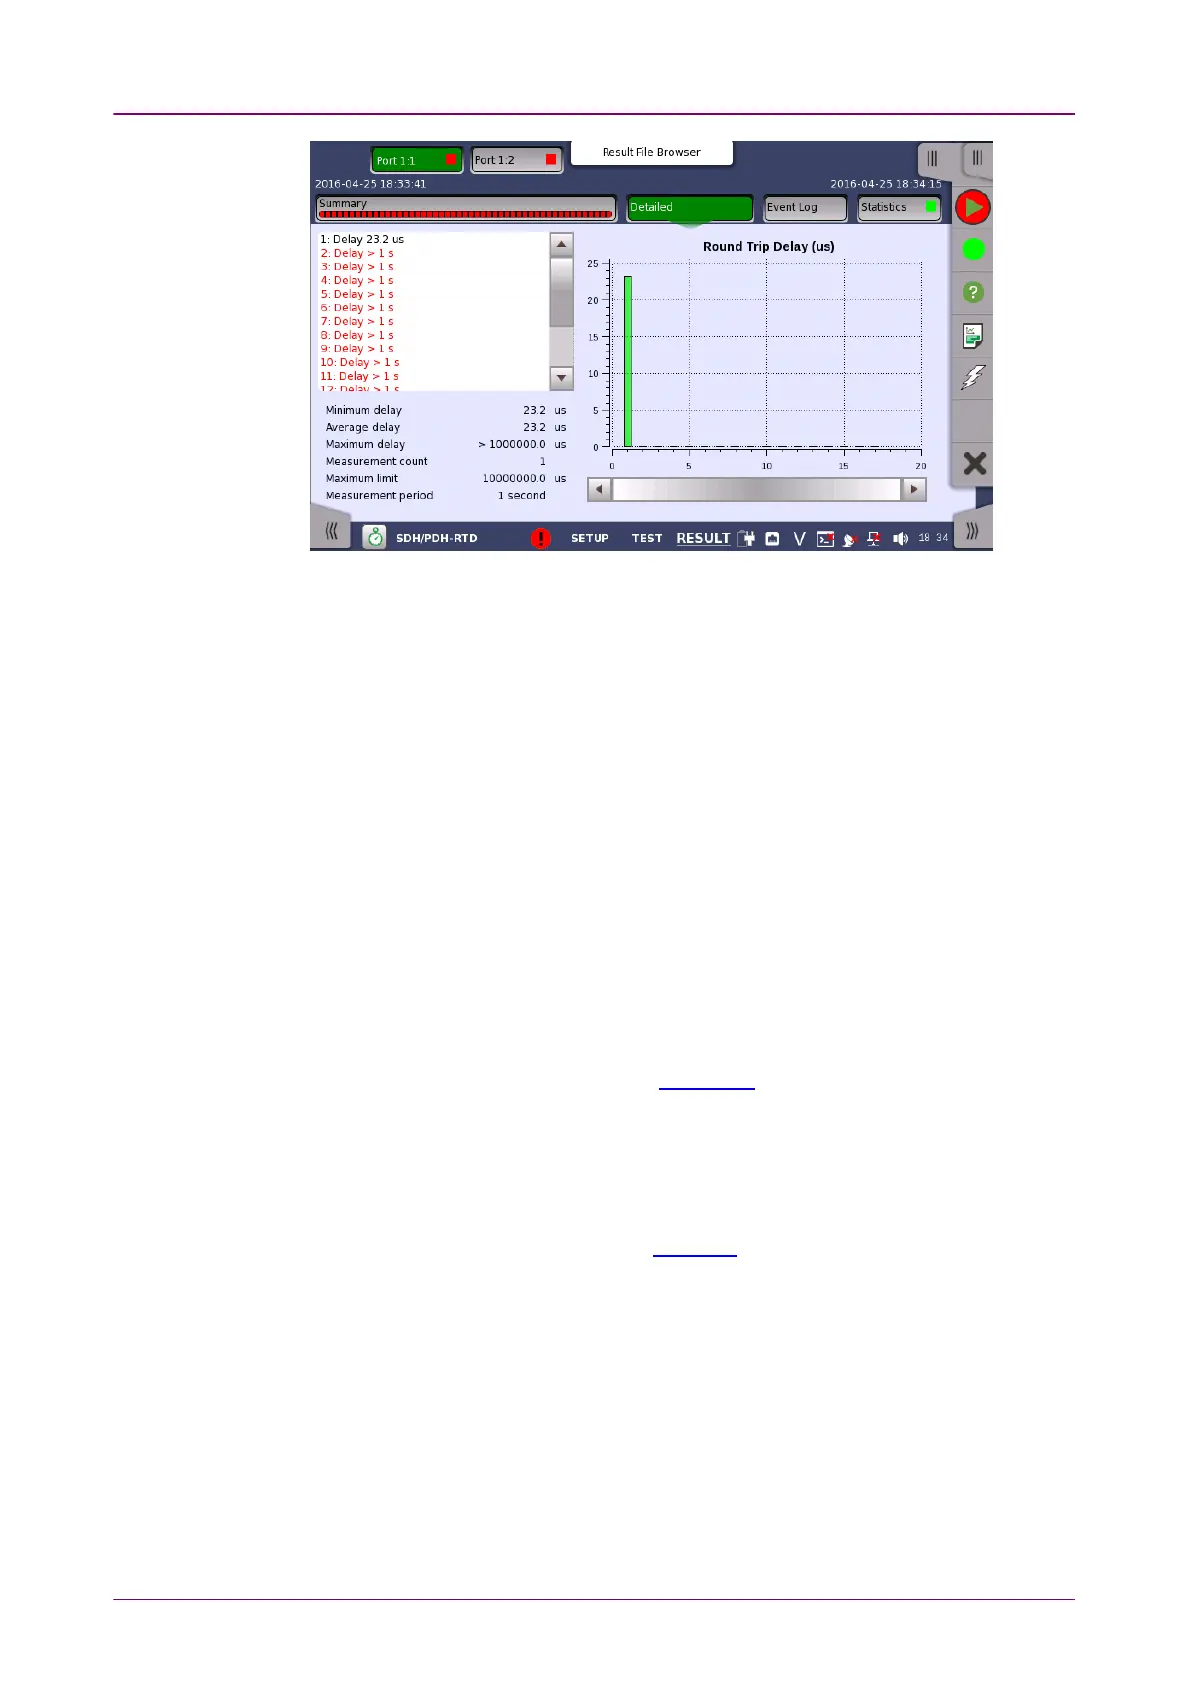
Buttons for selecting the relevant port are displayed at the top of the screen,
with a color indication of the pass/fail status of the test.
This screen presents the detailed results of an RTD test. The result is shown in
both list-form and in a graphical presentation. This screen contains the
summary field displayed below the list.
Consists of the minimum, average, and maximum round-trip delay times in
microseconds, the number of measurements, the specified threshold value and
measurement period.
Presents the results of an RTD test in list-form.
The graphical presentation consists of a bar diagram of the round-trip delay
times.
55..1010..66..33 Event LogEvent Log
Touching the Event LogEvent Log button in the navigation area displays the screen
providing the event log data. Refer to Event Log of SDH/SONET/PDH/DSn
BERT application.
55..1010..66..44 StatisticsStatistics
Touching the StatisticsStatistics button in the navigation area displays the screen
providing the statistics data. Refer to Statistics of BERT for the operation.