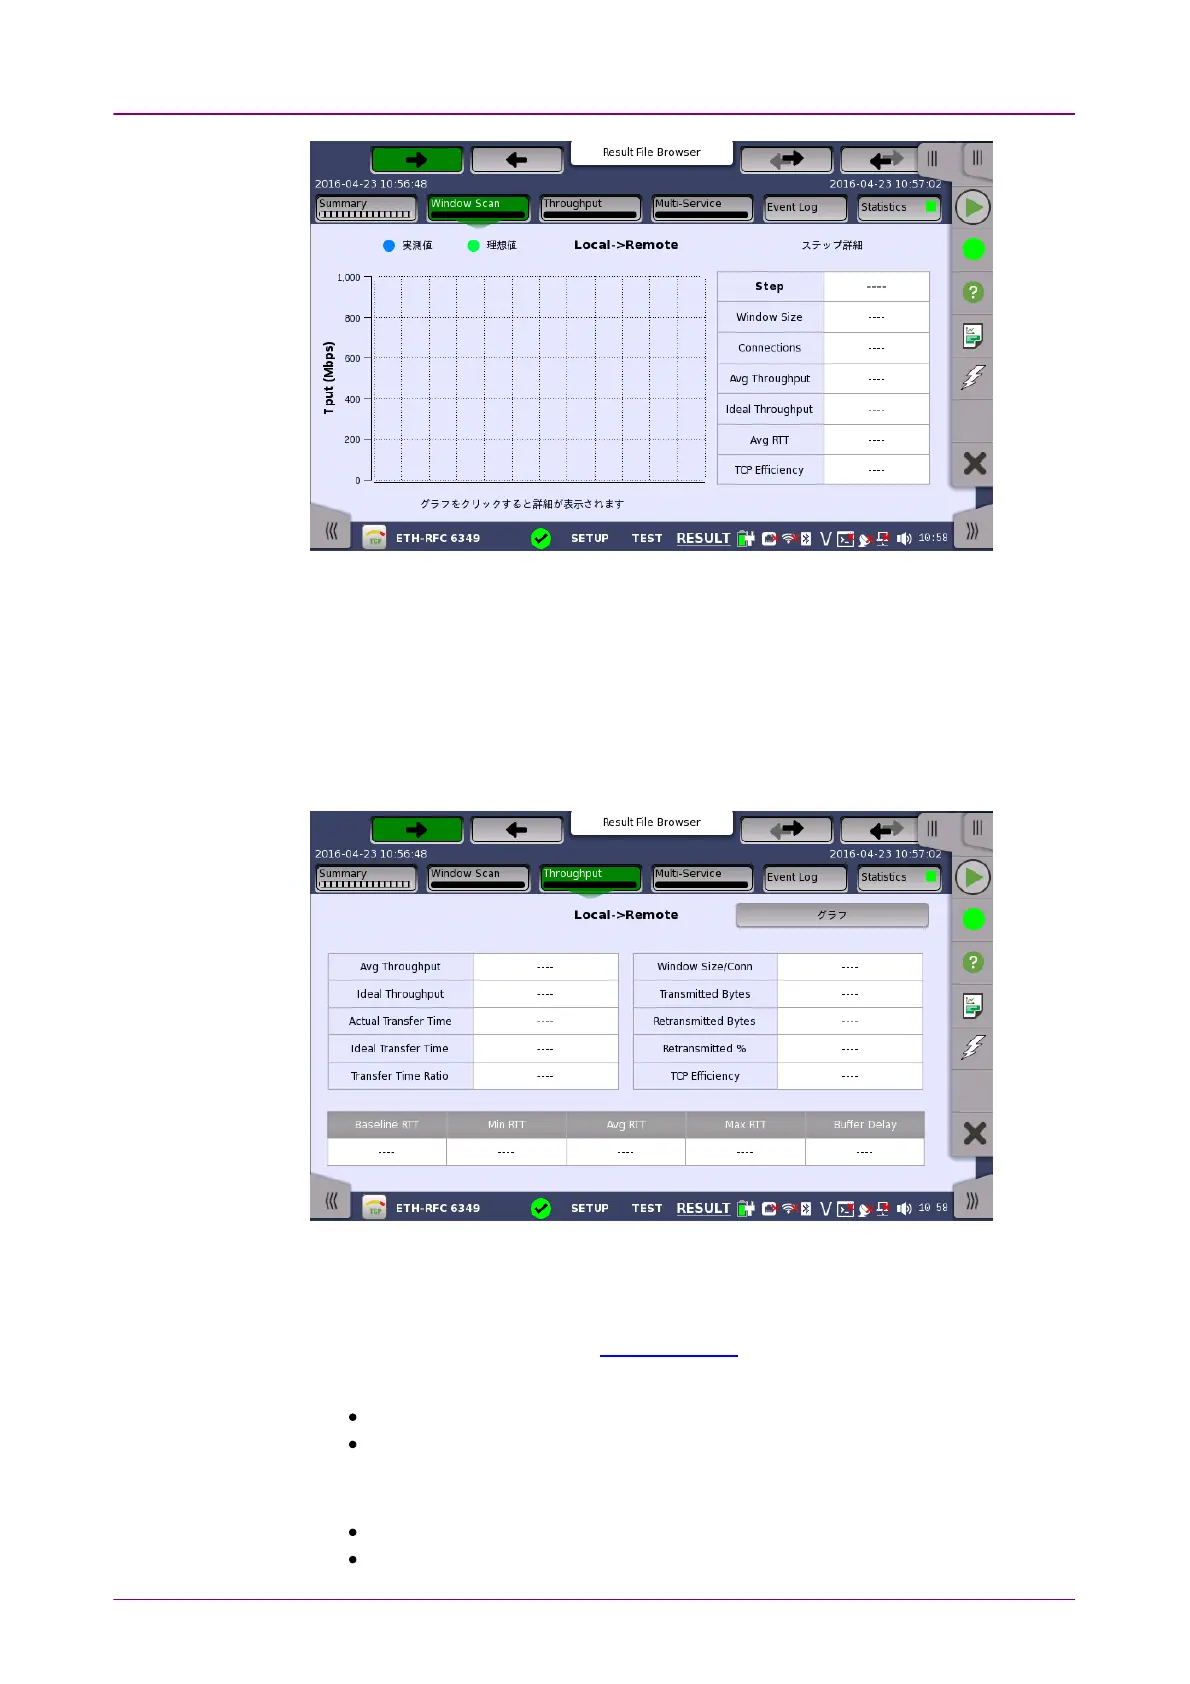
This screen presents the results from the Window Scan test. The ideal
throughput and the actual throughput are shown in the chart. If touching on the
Graph bars, step details appear in the right hand table.
66..1010..33..44 ThroughputThroughput
Touching the ThroughputThroughput button in the navigation area will display the screen
shown below.
This screen presents the Throughput results in graph or table. Touch the GraphGraph
and TableTable buttons to switch between the tabular form and a graphical
presentation of the results.
The ideal throughput, RTT and TCP Efficiency are shown in the graphical
presentation.
THPT/EFFTHPT/EFF: Throughput and TCP Efficiency
THPT/RTTTHPT/RTT: Throughput and Round Trip Time
Following results are displayed in the tabular form.
Avg Throughput
Ideal Throughput