Selecting the intervalSelecting the interval
timetime
InsertionInsertion
If selecting ManualManual, error(s) are inserted when you touch the Alarm/ErrorAlarm/Error
InsertInsert ( ).
Set OffOff to stop the error insertion.
Burst lengthBurst length
If 'Insertion' is set to ManualManual, touch the button and set the number of errors to
insert.
99..22..33..22 Event LogEvent Log
Touching the Event LogEvent Log button in the navigation area displays the screen
providing the event log data. Refer to Event Log of SDH/SONET/PDH/DSn
BERT application.
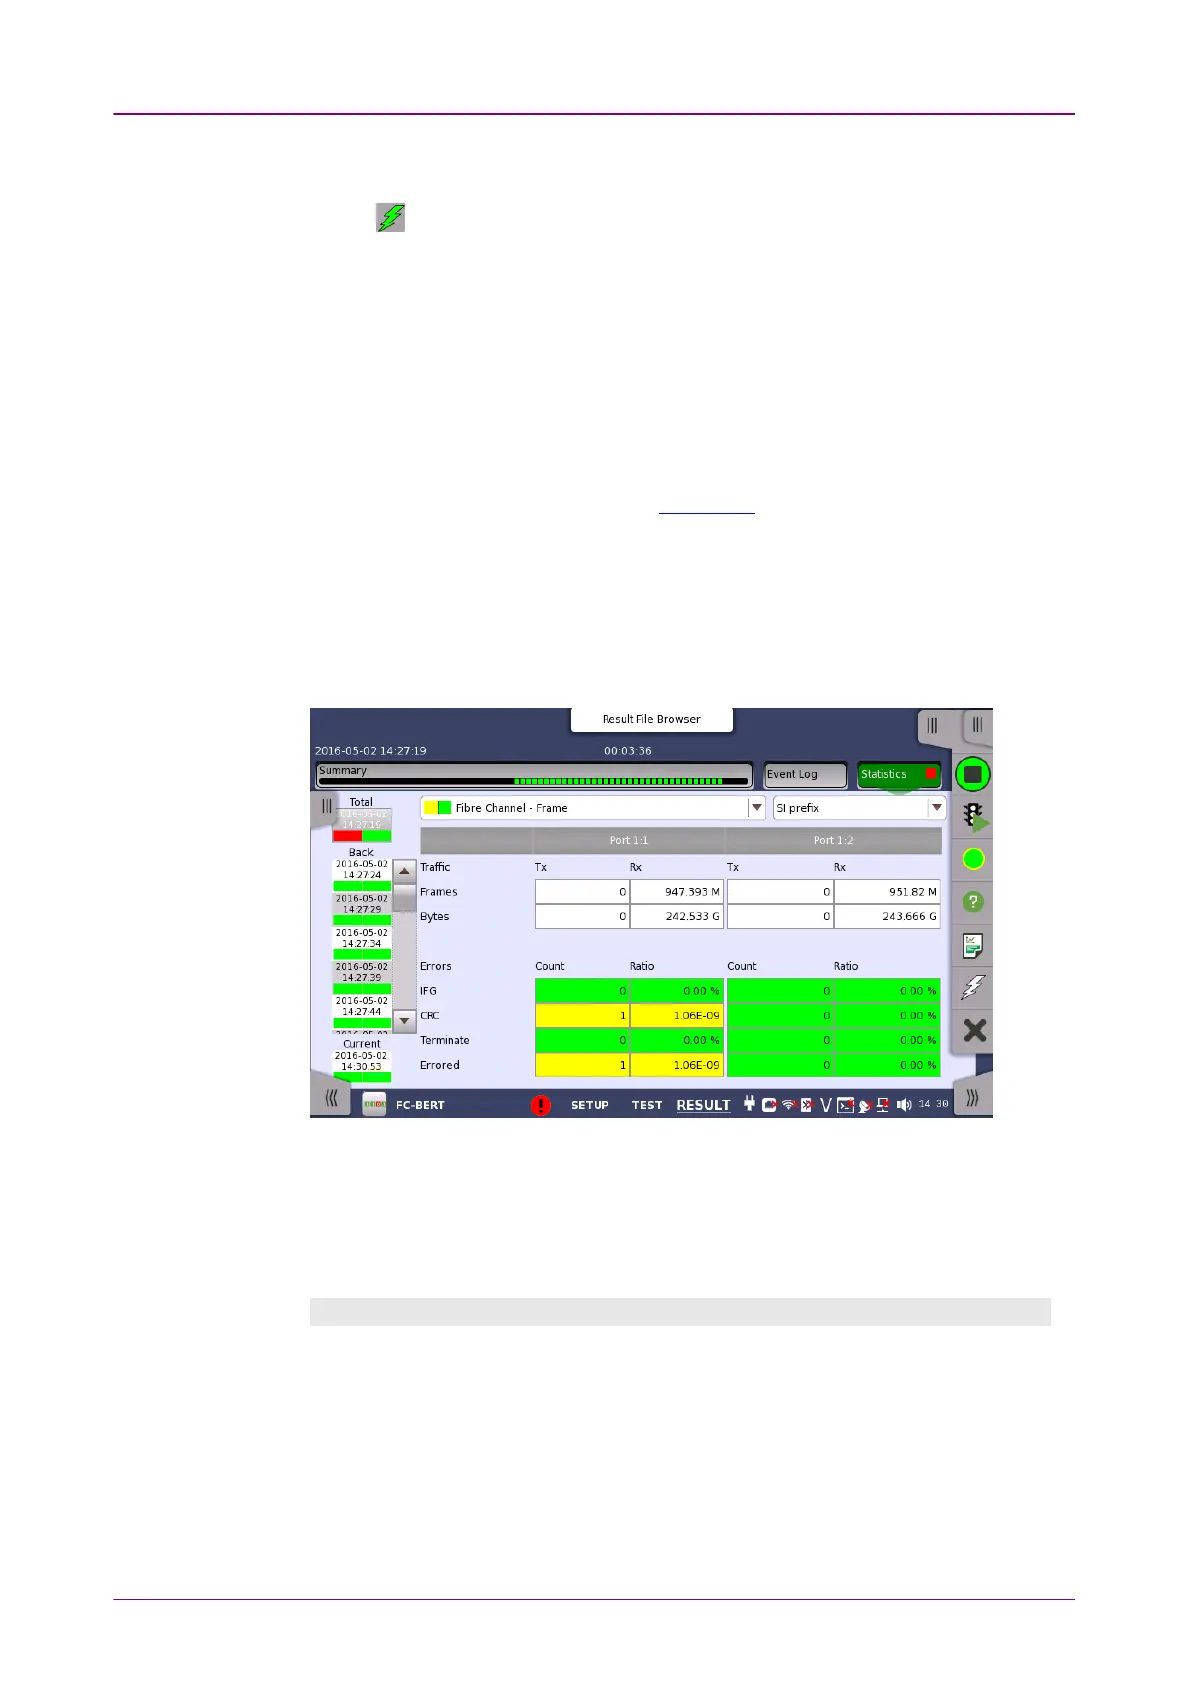
99..22..33..33 StatisticsStatistics
Touching the StatisticsStatistics button in the navigation area displays the screen shown
below.
This screen presents a detailed analysis of the test results. You can choose to
view either the results of a specific time interval or the total results from
measurement start. The results can be displayed either in table (list) form or as
graphs. You can also zoom in on a specific result item and display either a
zoom or a histogram.
Selecting which results to viewSelecting which results to view
Touch the TotalTotal button to switch the total values measured in all interval times.
The start time of measurement is displayed on the button.
Touching the button in left side BackBack field shows the measured values in the
interval time. The end time of the interval is displayed on the button.
CurrentCurrent button is displayed at left bottom when the measurement is running.
Touching the CurrentCurrent button shows the measured values in the current interval
time. The start time of the current interval is displayed on the button.