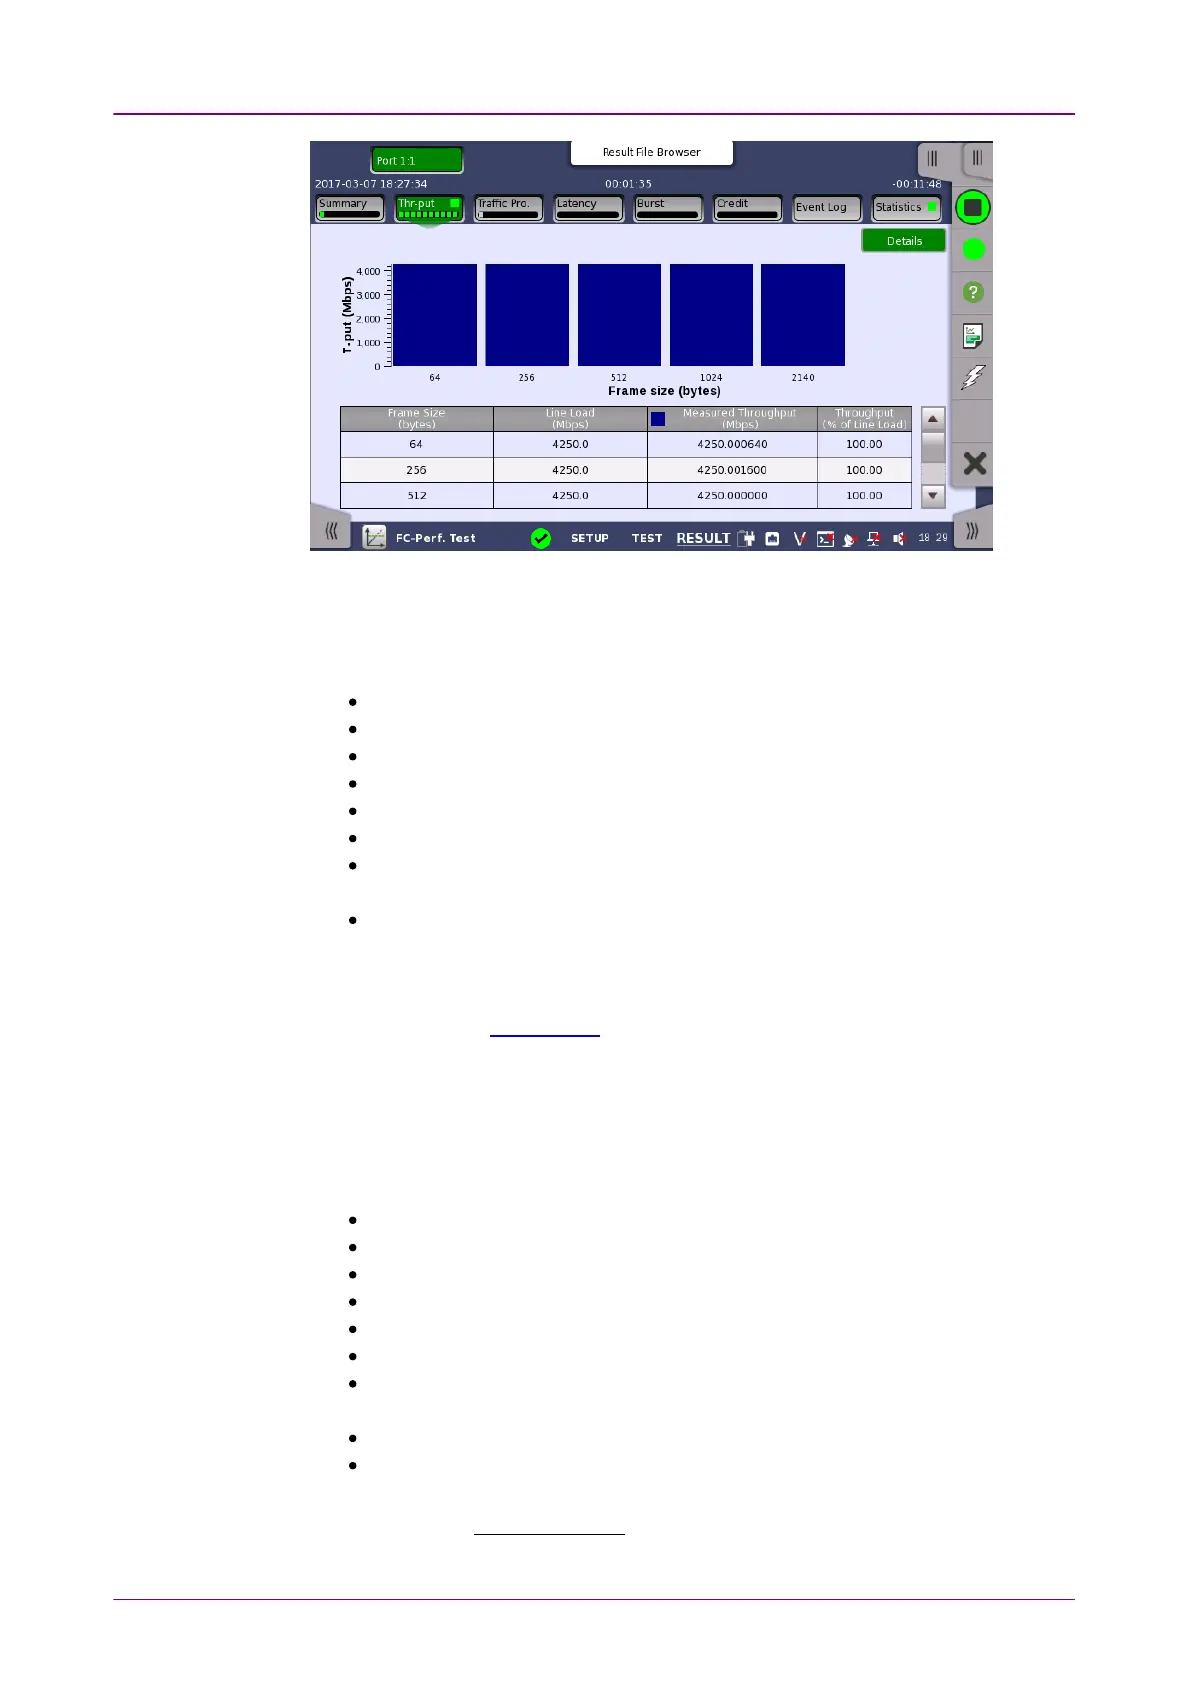
This screen displays the results of the Throughput test.
The measured throughput values are shown in a bar chart.
The following items are displayed in the result table.
Step: Step numbers in Throughput test
Fr size: Frame size defined in Control screen
Frames: Number of sent frames
Frame rate: Number of frames sent per second
Util: Utilization in percent
Load: Number of bits sent per second
Act Load / Tput: Number of frames received per second
This is a measured throughput.
Frames lost: Difference between sent frame count and received frame count
99..33..33..33 Traffic ProfileTraffic Profile
A screen similar to Throughput is displayed by touching Traffic ProfileTraffic Profile in the
Navigation area.
This screen displays the results of the Traffic Profile test.
The line load and measured throughput values are shown in bar charts.
The following items are displayed in the result table.
Step: Step numbers in Throughput test
Fr size: Frame size defined in Control screen
Frames: Number of sent frames
Frame rate: Number of frames sent per second
Util: Utilization in percent
Load: Number of bits sent per second
Act Load / Tput: Number of frames received per second
This is a measured throughput.
Frames lost: Difference between sent frame count and received frame count
Loss rt: Frame loss ratio in percent
It is calculated using the following formula:
Loss ratio =
Frame lost × 100
Frames