Interval or total resultsInterval or total results
Touching the Event LogEvent Log button in the navigation area displays the screen
providing the event log data. Refer to Event Log of SDH/SONET/PDH/DSn
BERT application.
99..44..33..33 StatisticsStatistics
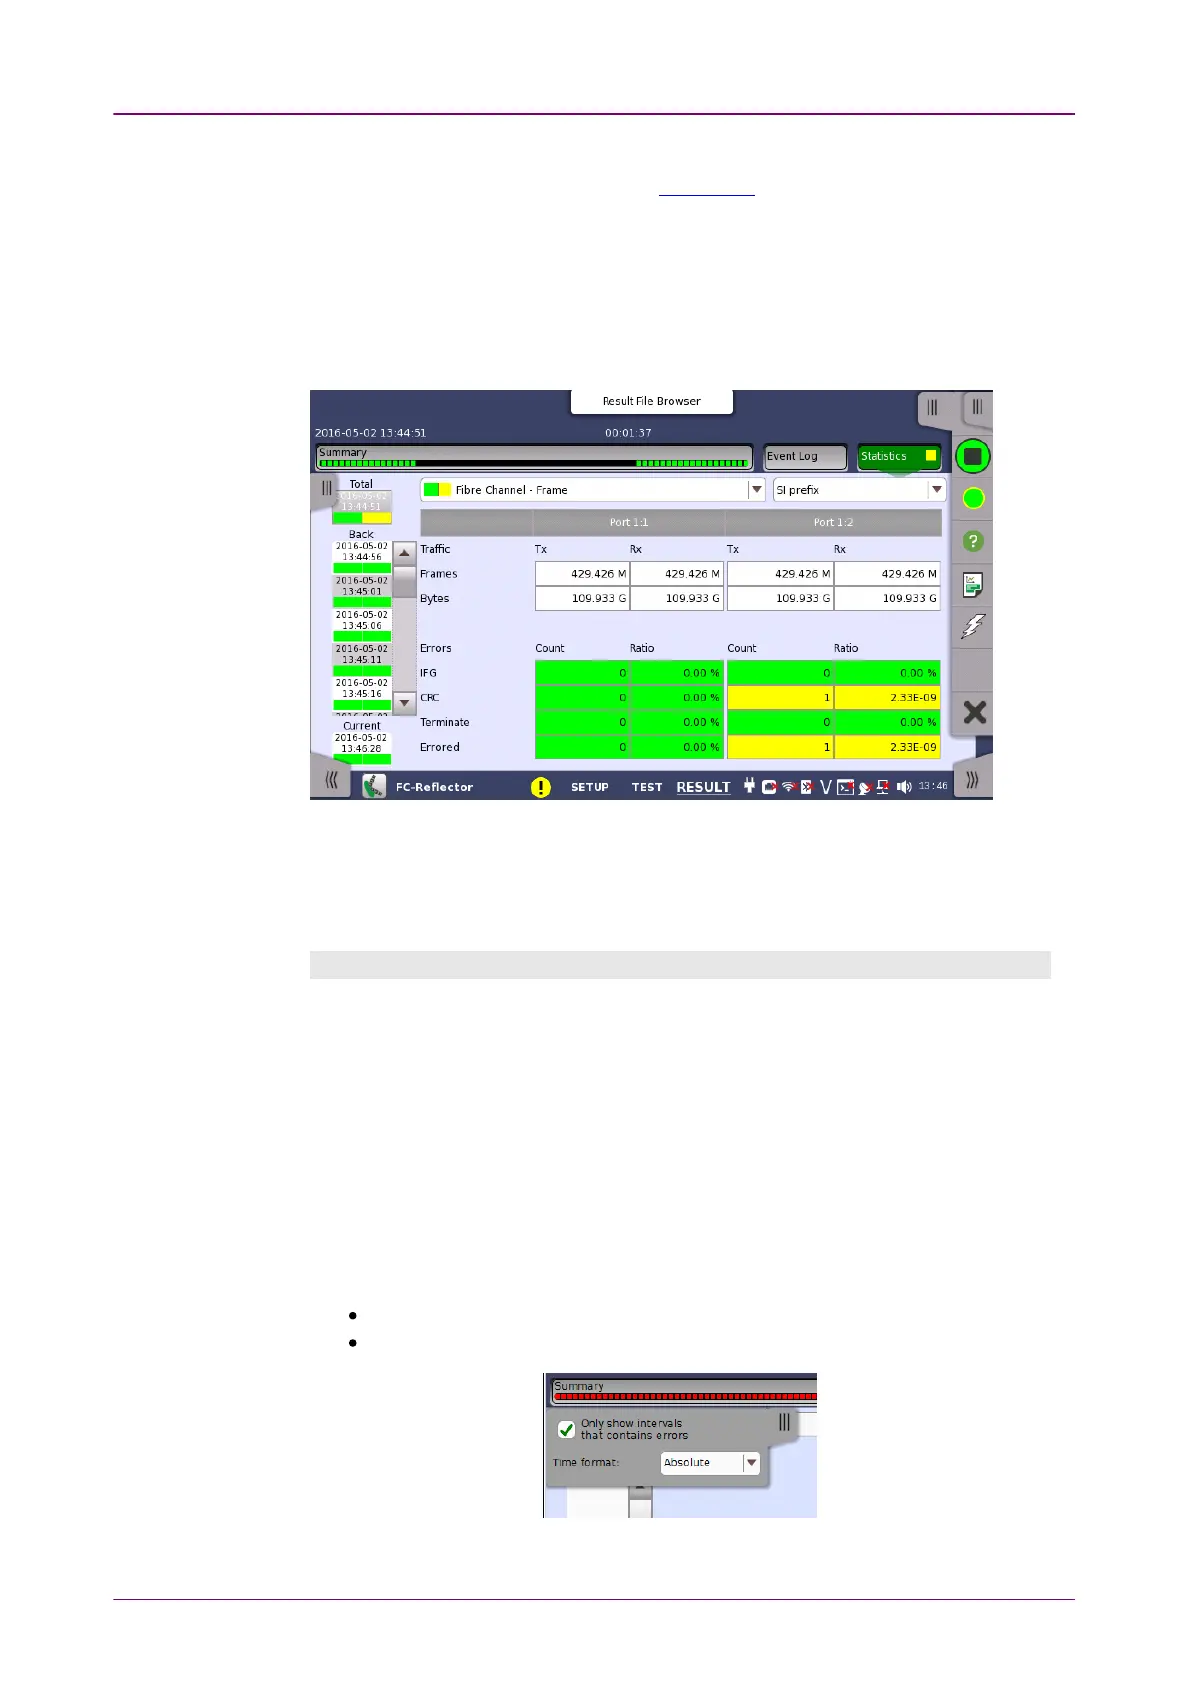
Touching the StatisticsStatistics button in the navigation area displays the screen shown
below.
This screen presents a detailed analysis of the test results. You can choose to
view either the total results from measurement start or the results of a specific
interval during the test. You can also zoom in on a specific result item. The
results can be displayed either in table (list) form or as a graph.
Selecting which results to viewSelecting which results to view
Touch the TotalTotal button to switch the total values measured in all interval times.
The start time of measurement is displayed on the button.
Touching the button in left side BackBack field shows the measured values in the
interval time. The end time of the interval is displayed on the button.
CurrentCurrent button is displayed at left bottom when the measurement is running.
Touching the CurrentCurrent button shows the measured values in the current interval
time. The start time of the current interval is displayed on the button.
The slide-out panel on the left-hand side of the screen contains the following
functions:
Only show intervals that contains errors
Time format