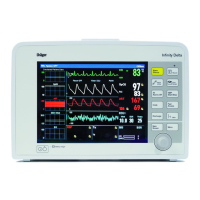
Monitoring
144
Instructions for use Primus Infinity Empowered SW 4.5n
Displayed parameters
CO2 concentration
– Curve display
The color of the curve can be configured by
DrägerService.
– Numerical display
– Trend curve for CO
2
O2 concentration
– Curve display
– Numerical display
– Trend curve for O
2
Anesthetic gases
– Curve display
– Numerical display
– Trend curve for anesthetic gases and MAC
Airway pressure
– Curve display (PAW)
– Numerical display
– Bar graph
SpO2 concentration (optional)
– Plethysmogram
– Numerical display
– Trend curve for SpO
2 and pulse
Flow and volume
– Curve display flow (insp./exp.)
– Numerical display
etCO2 : End-tidal CO2 concentration
inCO
2 : Inspiratory CO2 concentration
inO2 : Inspiratory O2 concentration
∆
O2 : Difference between inspiratory
and expiratory O2 concentration
insp. : Inspiratory anesthetic gas con-
centration
exp. : Expiratory anesthetic gas con-
centration
MAC : Minimum alveolar concentration
PEAK : Peak pressure
PLAT : Plateau pressure
PEEP : Positive end-expiratory pressure
P
MEAN : Mean pressure
(only on the data screen)
SpO
2 : Functional O2 saturation of the
blood
:Pulse rate
MV : Expiratory minute volume
V
T : tidal volume
VT
INSP : Measured inspiratory tidal vol-
ume
∆
VT : Difference between inspiratory
and expiratory tidal volume
MV
SPON : Spontaneously breathed expira-
tory minute volume